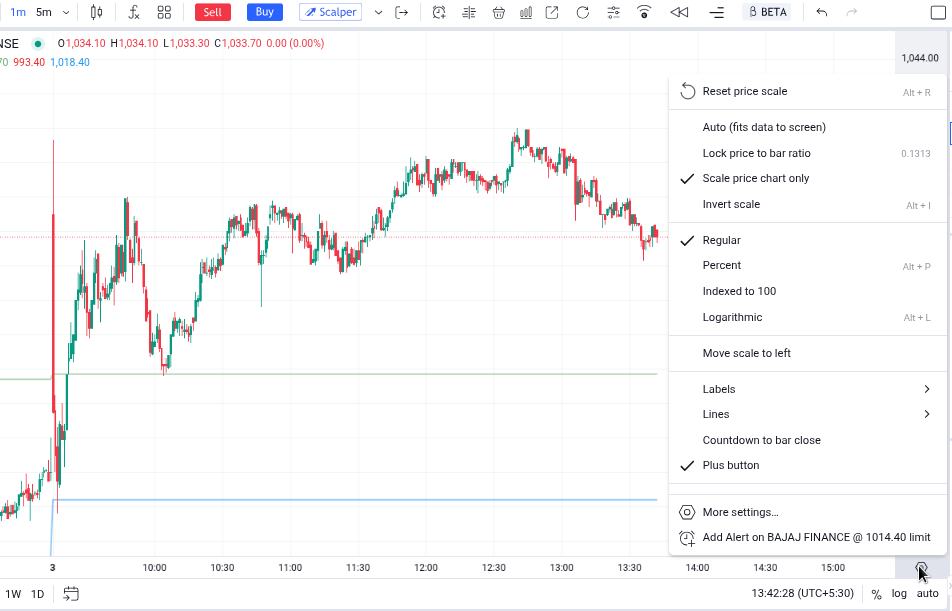
I want to plot the previous day’s OHLC levels on the chart, but the current indicator causes the price scale to distort on lower timeframes because it adjusts the chart to keep the lines visible.
The indicator should not affect or compress the chart scaling in any way. The previous day levels should simply be displayed without altering the existing price scale.
Additionally, I only want the following levels to be shown:
-
Previous Day High (PDH)
-
Previous Day Close (PDC)
-
Previous Day Low (PDL)
I do not want prior highs or lows from earlier sessions to be plotted.
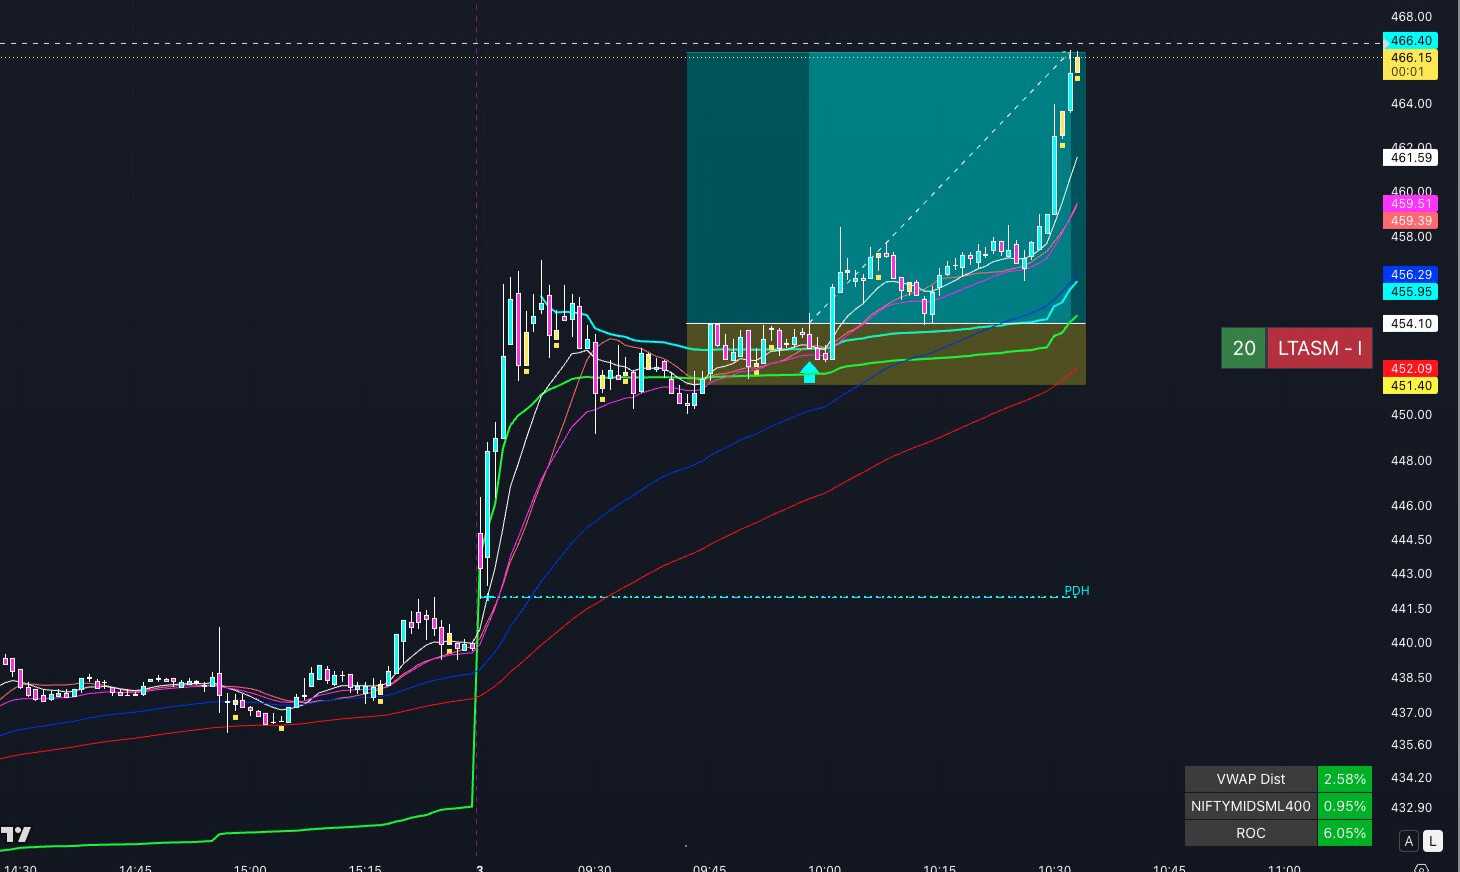
It would also be helpful if each line is annotated with a label such as PDH, PDC, and PDL so that the levels can be identified easily on the chart.
There is also another issue with the current implementation. The previous day levels are not plotted until the regular market session opens at 9:15 AM. Ideally, these levels should become visible immediately after the pre-market session ends, around 9:09 AM, so that traders can reference them during the final minutes before the market opens.
attaching an image for reference purposes(see the annotated line PDH):