The earlier you catch a breakout, the more profits you make ![]()
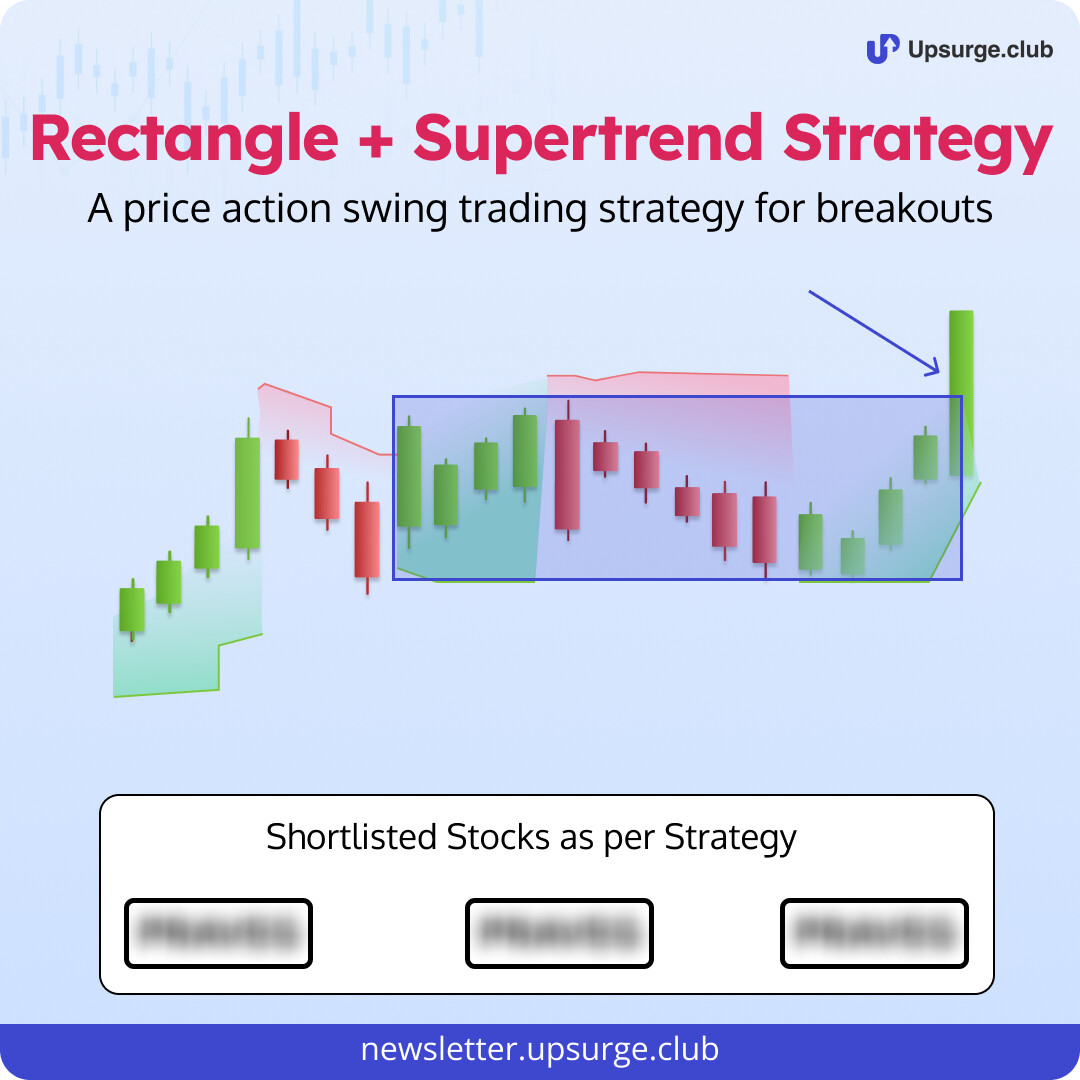
If you’re able to identify the 'usual range’ within which a stock is trading, you’ll be able to catch its breakout early. A rectangle pattern will help you identify that ‘usual range’.
A rectangle is a chart pattern that is formed when the price of a stock stays within an upper and lower limit. The price movement should generate at least 2 swing lows near a common level, and 2 swing highs near similar levels as well.
Learn how to combine the knowledge of a rectangle pattern and the Supertrend indicator for an effective swing trading strategy in our latest newsletter issue ![]()
Join 7000+ people getting actionable trading & investing strategies in their mailbox every other trading day by signing up for Upsurge’s Newsletter today!