Subject: Feature Request: Relative Rotation Graph (RRG) for Sector Analysis
Message: Hi Dhan Team,
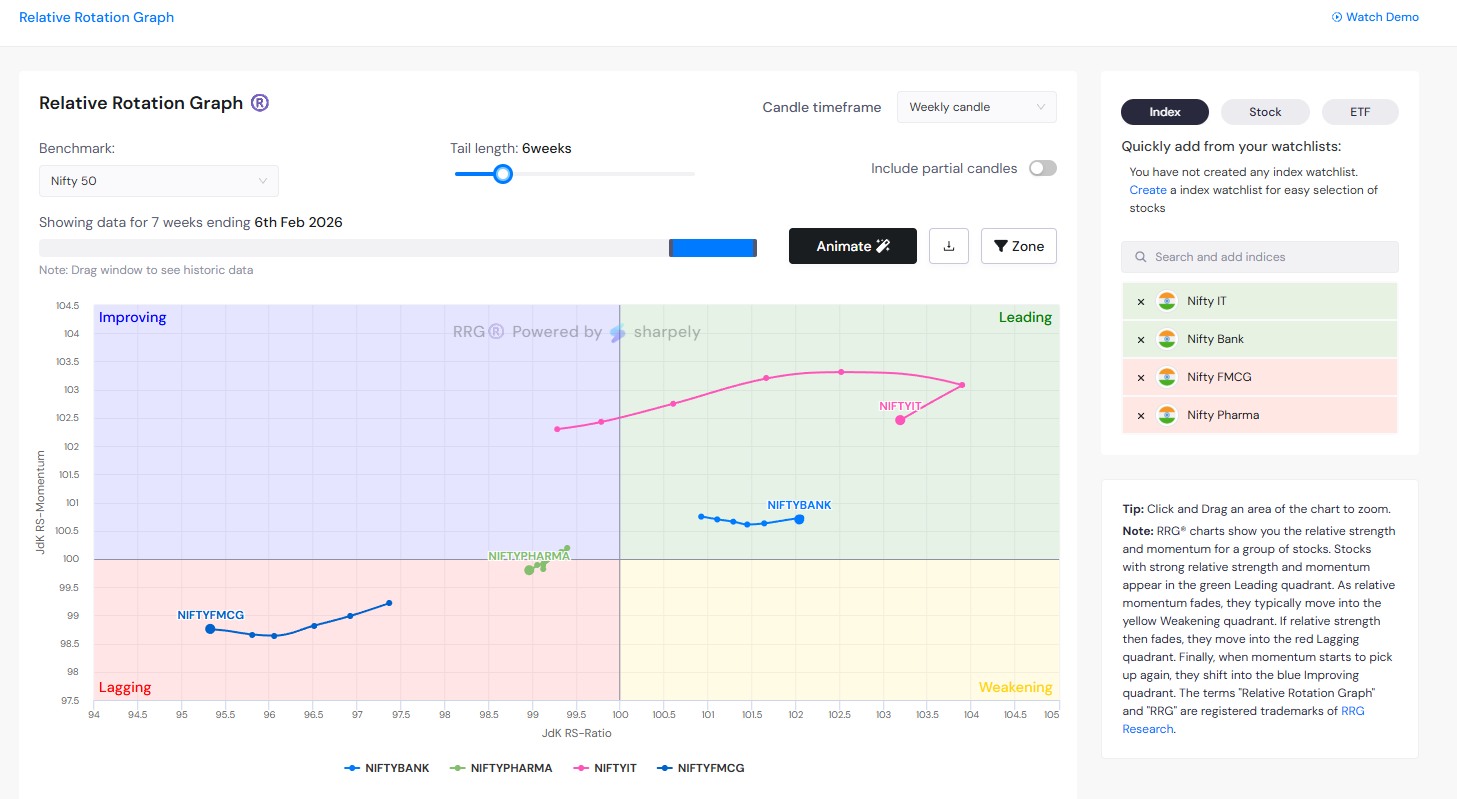
I am an active trader on Dhan and I really appreciate the advanced charting features you’ve built. I am writing to suggest a powerful new visualization tool: the Relative Rotation Graph (RRG).
As an options and equity trader, I currently have to use third-party websites to view RRG charts. Having this natively on Dhan would be a massive advantage.
Key Features Requested:
-
Four-Quadrant View: A scatter plot with Leading (Green), Weakening (Yellow), Lagging (Red), and Improving (Blue) quadrants.
-
Custom Benchmarks: The ability to compare Nifty Indices (Bank, IT, Pharma, etc.) or individual stocks against benchmarks like Nifty 50 or Nifty 500.
-
Historical Trails: A “tail” feature that shows the movement history of a security over the last 5-10 candles.
-
Multiple Timeframes: Support for Daily and Weekly RRG views.
This tool would help Dhan users identify early sector rotations and pick high-momentum stocks more effectively.
I hope to see this added to the “Made for Trade” roadmap soon!