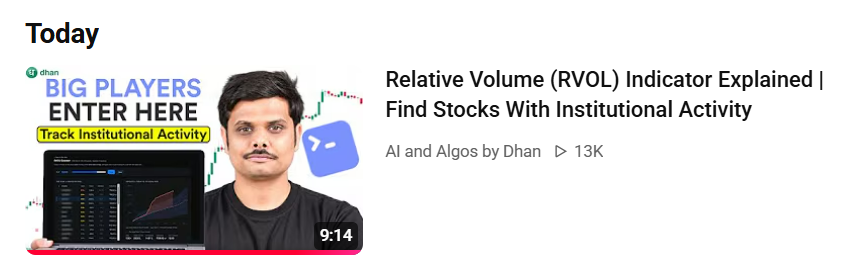
Hi Dhan Team, @Imran_Ahmad
I recently came across your video on Relative Volume, and it looks like a great screener. Could you please consider building this scanner into scanx and #DEXT3? I think it would be a great help to Dhan users.
1 Like
Dear Dhan Team,
I would like to request the addition of two useful features in the Dhan DEXT3 terminal:
-
Relative Volume (RVOL)
-
Display the current day’s volume compared with the average volume of the last 10 trading days.
-
For example: Relative Volume = Today’s Volume ÷ Average Volume of Previous 10 Days
-
-
Circuit Limit (%)
-
Display the applicable circuit limit of each stock directly in the terminal.
-
For example: 5%, 10%, 20%, etc.
-
These features would make it much easier to analyze volume activity and understand the price-movement for specially intraday trading. Please check the attachment for reference.
I would really appreciate it if the Dhan team could consider adding these features to DEXT3.
Thank you for continuously improving the platform.
Best regards,
Dinesh Kumar
Hi @Kothal and @Dinesh_Kumar6 ,
Tagging @Vaibhav_Lad and @Mrunmayi_Vaity for same
Thanks for sharing this.
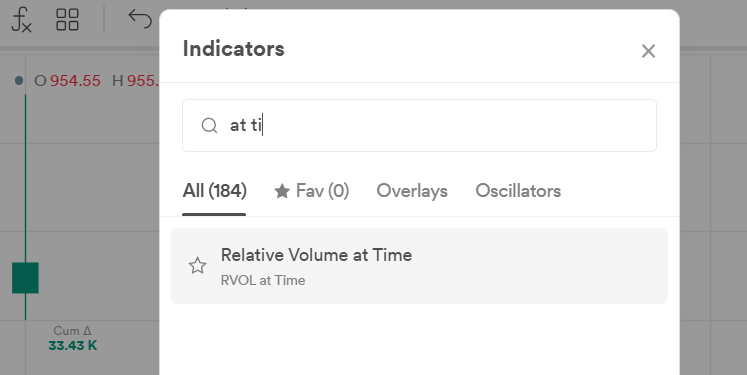
We already have RVOL at Time available in DEXT with a configurable lookback period. For example, if you set the lookback to 10 days and the indicator shows RVOL 2.13, it means the volume traded so far today is about 2.13x the average volume traded up to the same time over the previous 10 trading days.
This helps compare today’s activity on a like-for-like intraday basis, instead of just comparing partial-day volume with the full-day volume of previous sessions.
Please guide where in dext3. I can find relative volume feature
DEAR DHAN TEAM
I AM HAPPY TO SEE THE QUICK FROM YOUR TEAM.
ACTUALLY I AM LOOKING FOR RELATIVE VOLUME SCANNER NOT INDICATOR.
I AM SHARING A IMAGE WHAT I AM TAKING ABOUT
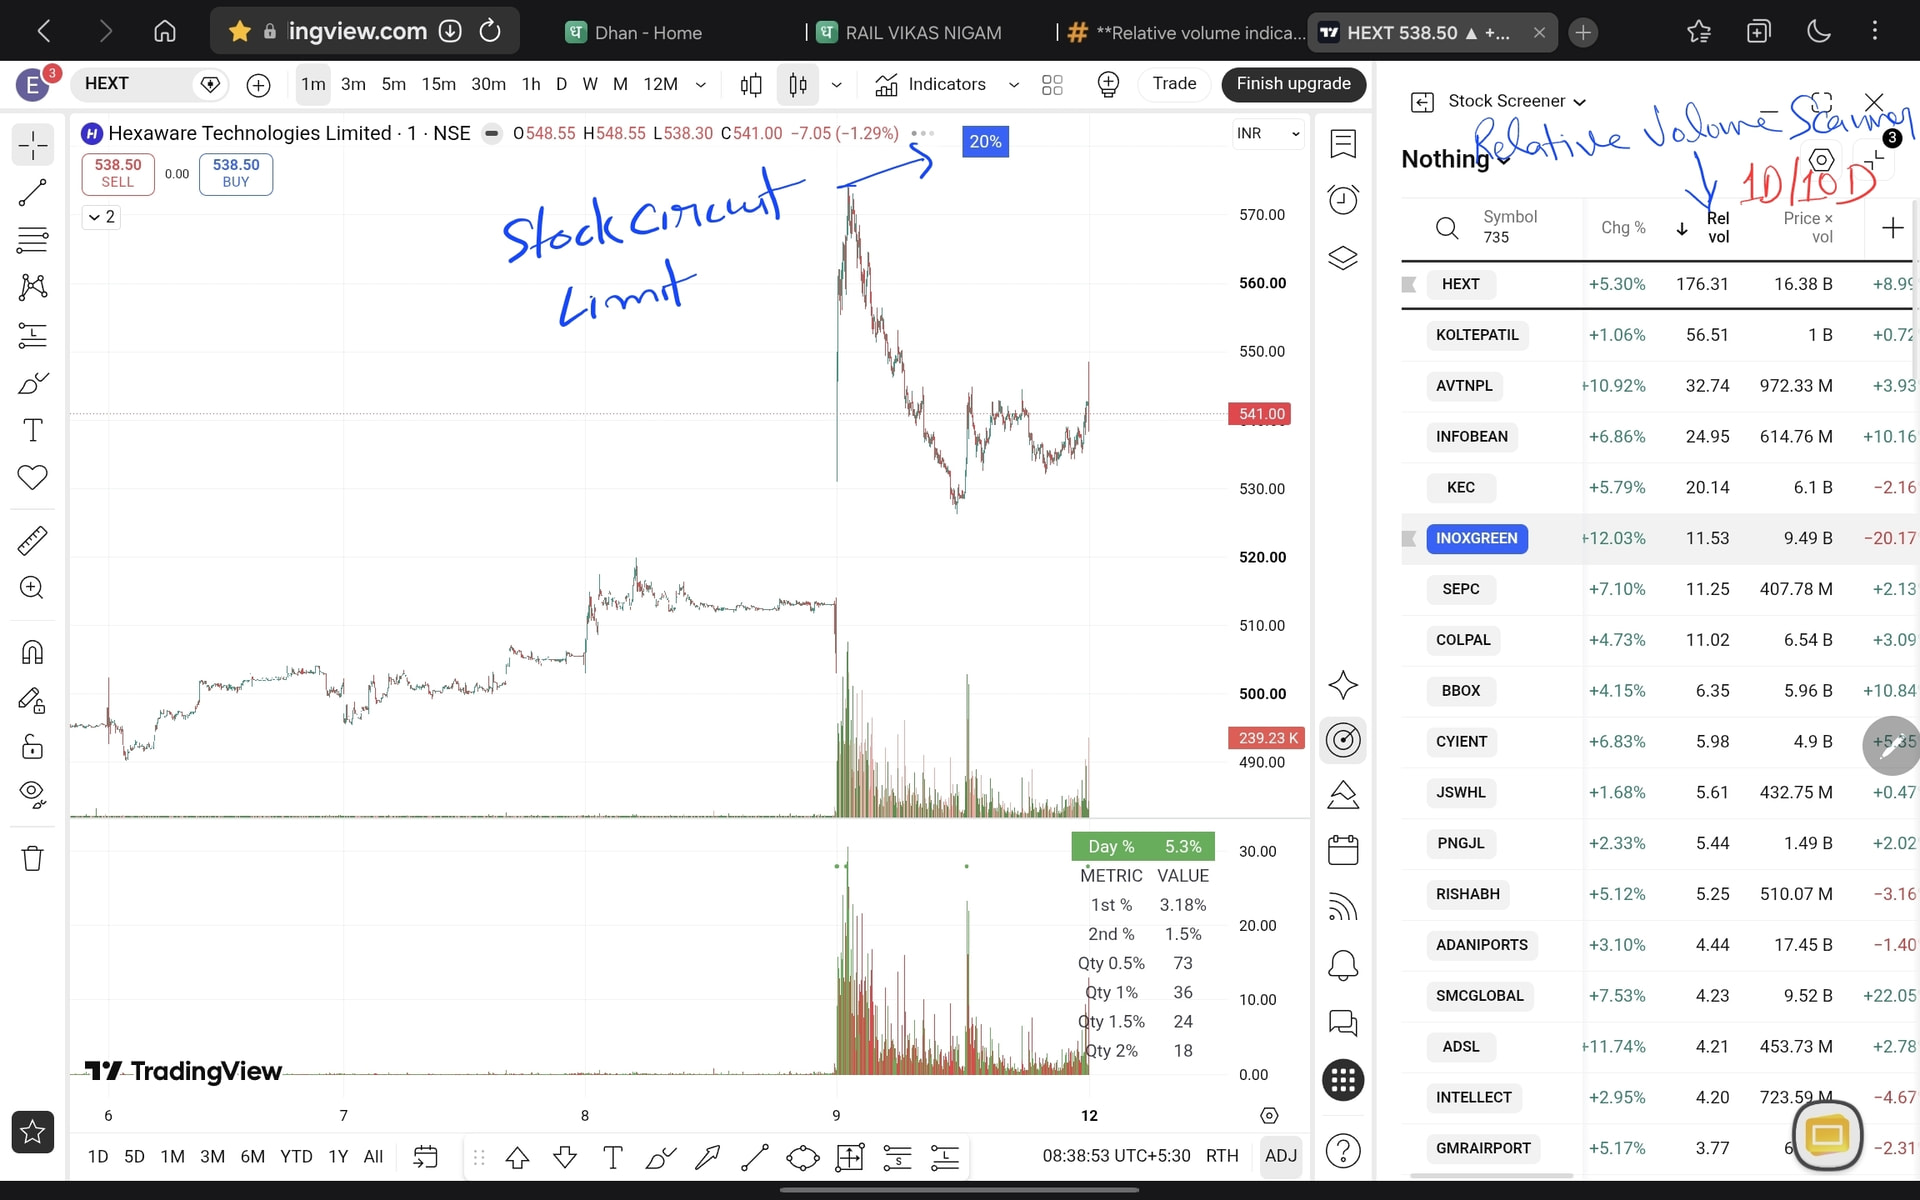
Using this scanner i can find high relative volume stocks. Like as you can see in image HEXT
IT CAN EASILY ADD IN MOVER WIDGETS OF DEXT3
THANKS
We want scanner of rvol not indicator. Dhan team please add
1 Like
@Rajmani_Gupta Ok We understood you’re looking for an RVOL scanner to discover stocks based on Relative Volume, rather than using RVOL only as an indicator. We’ll be developing this and will share an update once it’s available.
2 Likes
Dear @Bhavya_Jain
I would like to suggest adding some additional technical indicators and filters to the Custom Formula feature in Dext T3.
These features would be very useful for traders who rely on technical analysis to identify high-quality stocks and trading opportunities.
I request you to consider including the following parameters:
-
EMA (Exponential Moving Average): Customizable EMA periods such as 9, 20, 50, 100 and 200.
-
RSI (Relative Strength Index): Customizable RSI values and thresholds, such as RSI above 50 or 60.
-
MACD: MACD line, Signal line and Histogram conditions.
-
Minimum Relative Strength (RS) Score Threshold: A filter to identify stocks outperforming the benchmark index.
-
Average Daily Traded Volume: A filter based on average daily trading volume over a selected period.
-
Average Daily Traded Value: A filter based on average traded value to identify liquid stocks and avoid low-liquidity stocks.
Adding these indicators with customizable periods, thresholds and logical conditions (AND/OR) would make the Custom Formula feature much more powerful.
This would help Dhan Dext T3 customers build advanced technical screening strategies, identify momentum and breakout stocks, and make better-informed trading decisions.
I believe these enhancements would significantly improve the usefulness of Dhan Dext T3 and provide additional value to its customers.
I kindly request you to consider this feature enhancement and share your feedback on its feasibility and expected availability.
Thank you for your time and support.
@Mohsin_Khan In DEXT T3, you can create custom formulas and calculated columns using Fuzz Assistant, not just in Watchlist but also in Movers and Trending. You can also use Fuzz to create custom screeners based on supported technical conditions.
For more advanced requirements, including flexible indicator lengths, custom timeframes, relative strength comparisons and historical volume-based calculations, we’re looking at expanding these capabilities.