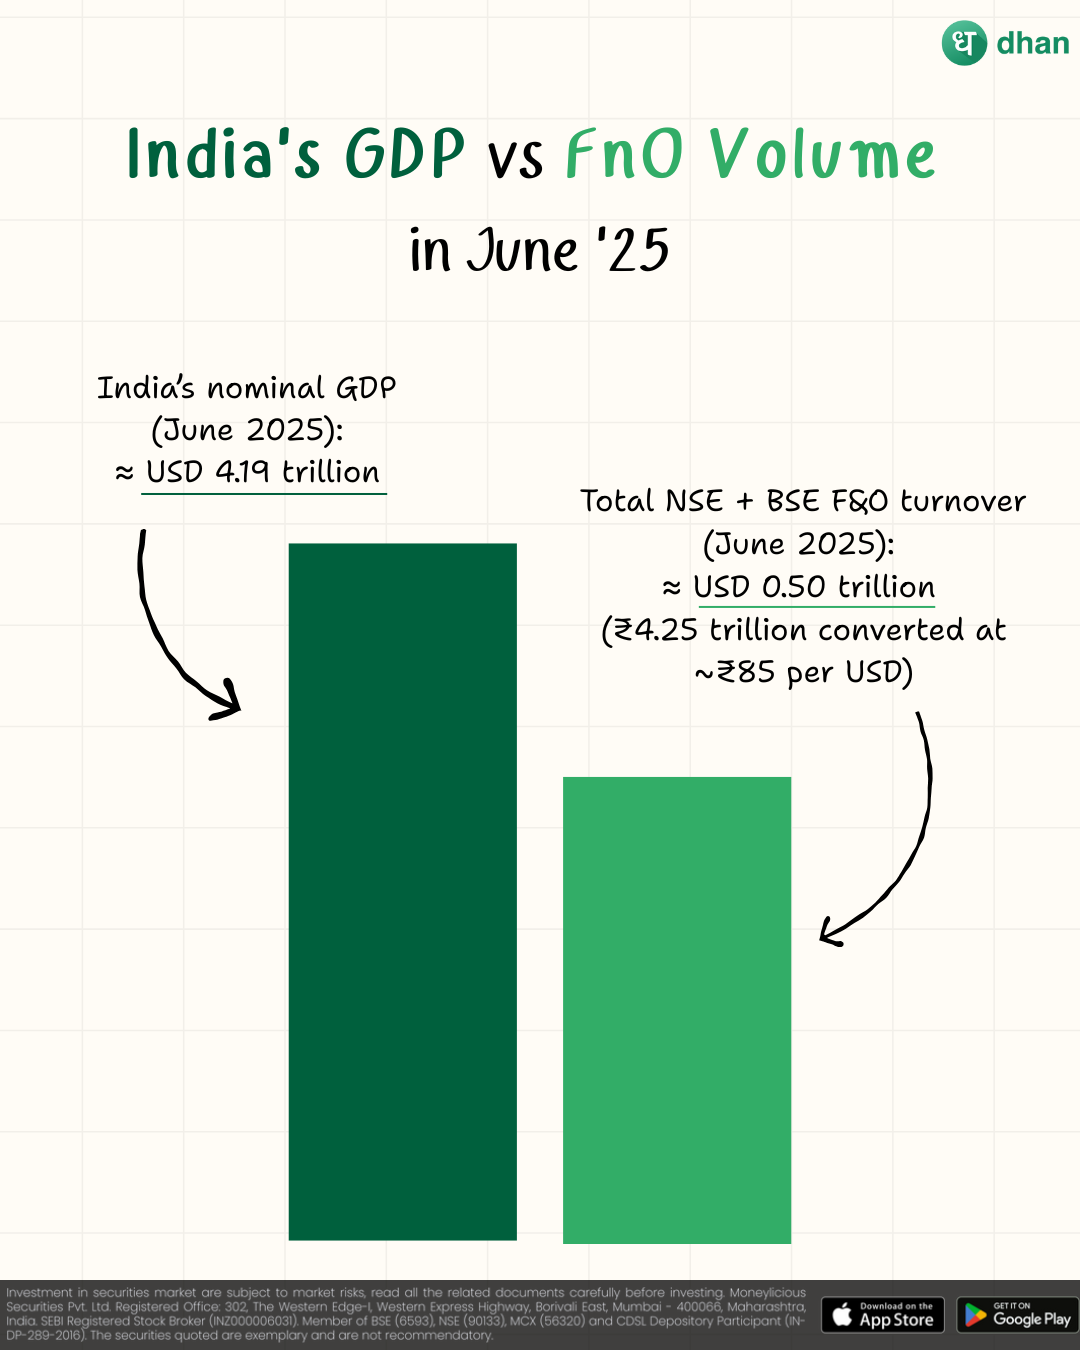
When we look at India’s current statistics, the numbers are simply mind-boggling. In June 2025, India’s nominal GDP stands at approximately $4.19 trillion, while the combined NSE and BSE F&O turnover reached $0.50 trillion in just one month. This means that in a single month, India’s derivatives trading volume represents 11.9% of its entire annual economic output.
To put this in perspective, imagine if every single economic transaction in the United States - from buying coffee to corporate acquisitions - happened 8.4 times over in just one month. That’s the scale we’re talking about with India’s derivatives market.
Historical GDP vs F&O Volume Growth: The Great Divergence
India’s Economic and Trading Evolution
| Year | India GDP (USD Trillion) | GDP Growth Rate (%) | F&O Volume (Monthly Avg, USD Billion) | F&O/GDP Ratio (Monthly) |
|---|---|---|---|---|
| 2000 | 0.47 | 3.84% | ~0.01 | 0.02% |
| 2005 | 0.82 | 7.92% | ~0.5 | 0.61% |
| 2010 | 1.68 | 8.50% | ~8 | 4.76% |
| 2015 | 2.10 | 8.00% | ~25 | 11.90% |
| 2020 | 2.67 | -5.78% | ~75 | 28.09% |
| 2025 | 4.19 | 7.40% | ~500 | 11.93% |
Key Observations:
- GDP grew 8.9x from 2000 to 2025
- F&O volume grew approximately 50,000x in the same period
- The F&O/GDP ratio peaked around 2020 before stabilizing
The Expiry Evolution Timeline
| Period | Expiry System | Key Changes | Impact on Volume |
|---|---|---|---|
| 2000-2010 | Monthly Only | Last Thursday of each month | Baseline growth |
| 2010-2019 | Weekly Introduction | Bank Nifty weekly expiry introduced | 5x volume increase |
| 2019-2023 | Multiple Weekly | Different indices on different days | 15x volume increase |
| 2023-2025 | Daily Expiry Era | Something expiring every trading day | 3x additional increase |
Global Comparison: India vs The World
Major Derivatives Markets Comparison (2023-2025)
| Country/Exchange | Annual Volume (Billion Contracts) | GDP (USD Trillion) | F&O/GDP Ratio | Primary Expiry System |
|---|---|---|---|---|
| India (NSE) | 85.0 | 4.19 | 11.93% | Daily (Mon-Fri) |
| USA (CME Group) | 6.2 | 27.36 | 0.23% | Monthly/Weekly |
| China (SHFE/DCE) | 4.8 | 17.89 | 0.27% | Monthly |
| Brazil (B3) | 3.1 | 2.13 | 1.46% | Monthly |
| South Korea (KRX) | 2.8 | 1.81 | 1.55% | Monthly |
| Germany (Eurex) | 2.4 | 4.12 | 0.58% | Monthly/Quarterly |
The Expiry Systems Across Major Markets
United States
- Monthly Options: Standard expiry on 3rd Friday
- Weekly Options: Introduced in 2005, expire every Friday
- Daily Options: Limited to SPY and QQQ only
- Volume Impact: Weekly options account for ~60% of equity options volume
China
- Monthly System: Traditional monthly expiry
- Limited Weekly: Only on major indices like SSE 50
- Regulatory Constraints: Strict position limits and trading hours
- Volume Growth: Steady but controlled growth
European Markets
- Quarterly Cycle: Traditional March, June, September, December
- Monthly Options: Available on major indices
- Weekly Options: Limited adoption
- Conservative Approach: Focus on institutional trading
Brazil
- Monthly Expiry: Traditional system
- Growing Retail: Increasing retail participation
- Limited Innovation: Slower adoption of frequent expires
The Anatomy of India’s Derivatives Explosion
Phase 1: The Foundation (2000-2010)
During this period, India’s derivatives market was in its infancy. The GDP expanded at healthy rates of 7-8% annually, while the F&O market was just finding its feet. Monthly expiries were the norm, and volumes were modest compared to cash market trading.
Key Metrics:
- Monthly F&O volume: ~$1-8 billion
- Primary participants: Institutional investors and wealthy individuals
- Expiry system: Monthly only (last Thursday)
- F&O/GDP ratio: 0.02% to 4.76%
Phase 2: The Acceleration (2010-2019)
This phase marked the beginning of India’s derivatives revolution. Much of this growth followed the introduction of weekly-expiring contracts in 2019, replacing the traditional month-end expirations. The introduction of weekly expiries was a game-changer.
Key Metrics:
- Monthly F&O volume: $8-75 billion
- Retail participation: Massive influx of retail traders
- Expiry system: Monthly + Weekly
- F&O/GDP ratio: 4.76% to 28.09%
Phase 3: The Dominance (2019-2025)
India has gone from a small player in the equity derivatives market to the world’s largest within just five years, with the National Stock Exchange of India cementing its place as the largest derivatives exchange in the world in 2023.
Key Metrics:
- Monthly F&O volume: $75-500 billion
- Market position: World’s largest derivatives exchange
- Expiry system: Daily expiries across different indices
- F&O/GDP ratio: Stabilized around 12%
The Daily Expiry Revolution: A Global First
India’s innovation of having daily expiries is unprecedented globally. Here’s how it works:
Weekly Expiry Schedule (Current System)
| Day | Index | Typical Volume (Daily) |
|---|---|---|
| Monday | Nifty Midcap Select | $15-20 billion |
| Tuesday | Nifty | $80-100 billion |
| Wednesday | Bank Nifty | $120-150 billion |
| Thursday | Nifty Financial Services | $25-30 billion |
| Friday | Sensex | $10-15 billion |
Global Comparison of Expiry Innovation
| Innovation | India | USA | Europe | China |
|---|---|---|---|---|
| Monthly Expiry | ✓ (Since 2000) | ✓ (Since 1970s) | ✓ (Since 1980s) | ✓ (Since 2010) |
| Weekly Expiry | ✓ (Since 2019) | ✓ (Since 2005) | Limited | Very Limited |
| Daily Expiry | ✓ (Since 2023) | Very Limited | ✗ | ✗ |
| Multiple Index Daily | ✓ (Unique) | ✗ | ✗ | ✗ |
The Economic Implications: When Finance Outgrows Economy
Volume-to-GDP Ratios: A Global Perspective
The relationship between derivatives volume and GDP reveals fascinating insights about financial market development:
Developed Markets Pattern:
- USA: 0.23% (Mature, institutional-focused)
- Germany: 0.58% (Conservative, bank-dominated)
- UK: ~0.40% (Post-Brexit adjustment)
Emerging Markets Pattern:
- Brazil: 1.46% (Growing retail participation)
- South Korea: 1.55% (Tech-savvy population)
- India: 11.93% (Unprecedented retail frenzy)
The Retail Revolution in Numbers
India’s derivatives boom is primarily driven by retail participation:
| Participant Type | 2019 Share | 2025 Share | Growth Factor |
|---|---|---|---|
| Retail Investors | 15% | 85% | 5.67x |
| Institutional | 60% | 12% | 0.20x |
| Proprietary | 25% | 3% | 0.12x |
Why India’s Model is Unique
1. Technological Infrastructure
- Real-time settlement systems
- Mobile-first trading platforms
- Ultra-low latency matching engines
2. Regulatory Innovation
- Gradual liberalization of expiry systems
- Balanced approach to risk management
- Enabling retail participation while maintaining stability
3. Cultural Factors
- High savings rate channeled into markets
- Tech-savvy young population
- Social media-driven trading communities
4. Economic Democratization
- Low minimum capital requirements
- Accessible trading platforms
- Educational initiatives
Latest Development: NSE’s Expiry Day Revolution (June 2025)
The Tuesday Transition: A Market-Changing Decision
Just as we analyze India’s derivatives evolution, the NSE has made another groundbreaking change that will further reshape the market landscape. On June 25, 2025, the NSE issued Circular 111/2025, announcing a significant revision in expiry days for index and stock derivatives contracts.
Key Changes Announced
| Contract Type | Previous Expiry Day | New Expiry Day | Effective Date |
|---|---|---|---|
| NIFTY Monthly/Quarterly/Half-yearly | Last Thursday of month | Last Tuesday of month | September 2025 onwards |
| NIFTY Weekly | Thursday of the week | Tuesday of the week | September 2025 onwards |
| BANKNIFTY Monthly/Quarterly | Last Thursday of month | Last Tuesday of month | September 2025 onwards |
| FINNIFTY, MIDCPNIFTY, NIFTYNXT50 | Last Thursday of month | Last Tuesday of month | September 2025 onwards |
| Single Stock Options | Last Thursday of month | Last Tuesday of month | September 2025 onwards |
Implementation Timeline
Phase 1: Immediate Effect (June 26, 2025)
- New contracts with September 2025 expiry and beyond will be generated with Tuesday expiry
- Existing contracts expiring on/before August 31, 2025 remain unchanged
Phase 2: Realignment (July 31, 2025)
- Long-dated NIFTY & BANKNIFTY option contracts (September 2025 onwards) will be realigned to Tuesday expiry
- Updated contract master files will reflect the changes
Strategic Implications of the Tuesday Shift
This change represents more than just a day adjustment - it’s a strategic repositioning of India’s derivatives market:
1. Market Distribution Benefits
- Reduced Thursday Concentration: Previously, most major expiries clustered on Thursdays
- Better Weekly Spread: More even distribution of expiry-related volumes across the week
- Enhanced Liquidity: Trading activity spread more evenly throughout the week
2. New Weekly Expiry Calendar
| Day | Index | Volume Impact |
|---|---|---|
| Monday | Nifty Midcap Select | Stable |
| Tuesday | NIFTY + BANKNIFTY | Massive increase expected |
| Wednesday | Bank Nifty (existing) | Potential decrease |
| Thursday | Nifty Financial Services | Stable |
| Friday | Sensex | Stable |
3. Trading Strategy Revolution
- Tuesday Becomes Super-Expiry Day: Combining NIFTY and BANKNIFTY expiries
- New Arbitrage Opportunities: Tuesday-Wednesday expiry spreads
- Risk Management: Institutions need to rebalance their weekly exposure patterns
Global Context: Why Tuesday Matters
This move further solidifies India’s position as the most innovative derivatives market globally:
International Comparison:
- USA: Maintains Friday expiry tradition since 1973
- Europe: Sticks to Friday expiry for most contracts
- India: Now has Tuesday as the primary expiry day
This Tuesday shift could influence global expiry patterns, as other exchanges may follow India’s lead in optimizing weekly trading distributions.
Market Impact Projections
Expected Volume Redistribution:
- Tuesday Volume: Could increase by 40-60% due to combined NIFTY + BANKNIFTY expiries
- Wednesday Volume: May decrease by 20-30% as some activity shifts to Tuesday
- Overall Weekly Volume: Expected to increase by 10-15% due to better distribution
Trading Behavior Changes:
- Institutional Strategies: Need to adjust weekly hedging patterns
- Retail Participation: Tuesday could become the new “super expiry” day for retail traders
- International Traders: Asian timezone advantages for Tuesday expiries
The Future Trajectory
Potential Scenarios for India
Scenario 1: Continued Growth
- F&O volume could reach $1 trillion monthly by 2030
- GDP growth of 6-7% annually
- F&O/GDP ratio stabilizing around 15%
- Tuesday expiry model adopted by other global exchanges
Scenario 2: Regulatory Cooling
- Stricter position limits
- Higher margin requirements
- F&O/GDP ratio dropping to 8-10%
- Potential reversal of expiry day innovations
Scenario 3: Global Adoption
- Other countries adopting daily expiry models
- Tuesday expiry becoming international standard
- India maintaining leadership but with reduced dominance
- More balanced global derivatives ecosystem
Global Implications
Global futures and options volume hit a record 137 billion contracts in 2023, with India contributing the largest share. This has several implications:
- Regulatory Scrutiny: Global regulators are studying India’s model
- Market Structure: Other exchanges considering similar innovations
- Risk Management: New approaches needed for such high-frequency expiries
- Economic Impact: Understanding the relationship between financial markets and real economy
India’s journey from a $0.01 billion monthly F&O market in 2000 to $500 billion in 2025 represents more than just growth - it’s a fundamental shift in how financial markets can evolve. The progression from monthly to daily expiries has created a financial ecosystem that operates at a scale and frequency unprecedented in global markets.
How many of you switched from monthly to weekly to daily expiries? And how did it change your win rate?