Hi @Everyone,
Cross-sectional momentum, explained step by step for retail traders
Introduction
When you and I build a strategy as retail traders, we usually think trade by trade: an RSI signal, a breakout, a stop loss and a target. A hedge fund thinks differently. It builds a portfolio, compares hundreds of stocks against each other, and lets a rule-based process decide what to hold.
In this guide we walk through one such strategy: cross-sectional momentum. We follow the same five steps shown in the video: Universe, Rank, Steadiness, Entry, Rebalance. Along the way we look at how funds think differently from retail traders, so you can improve how you build your own strategies.
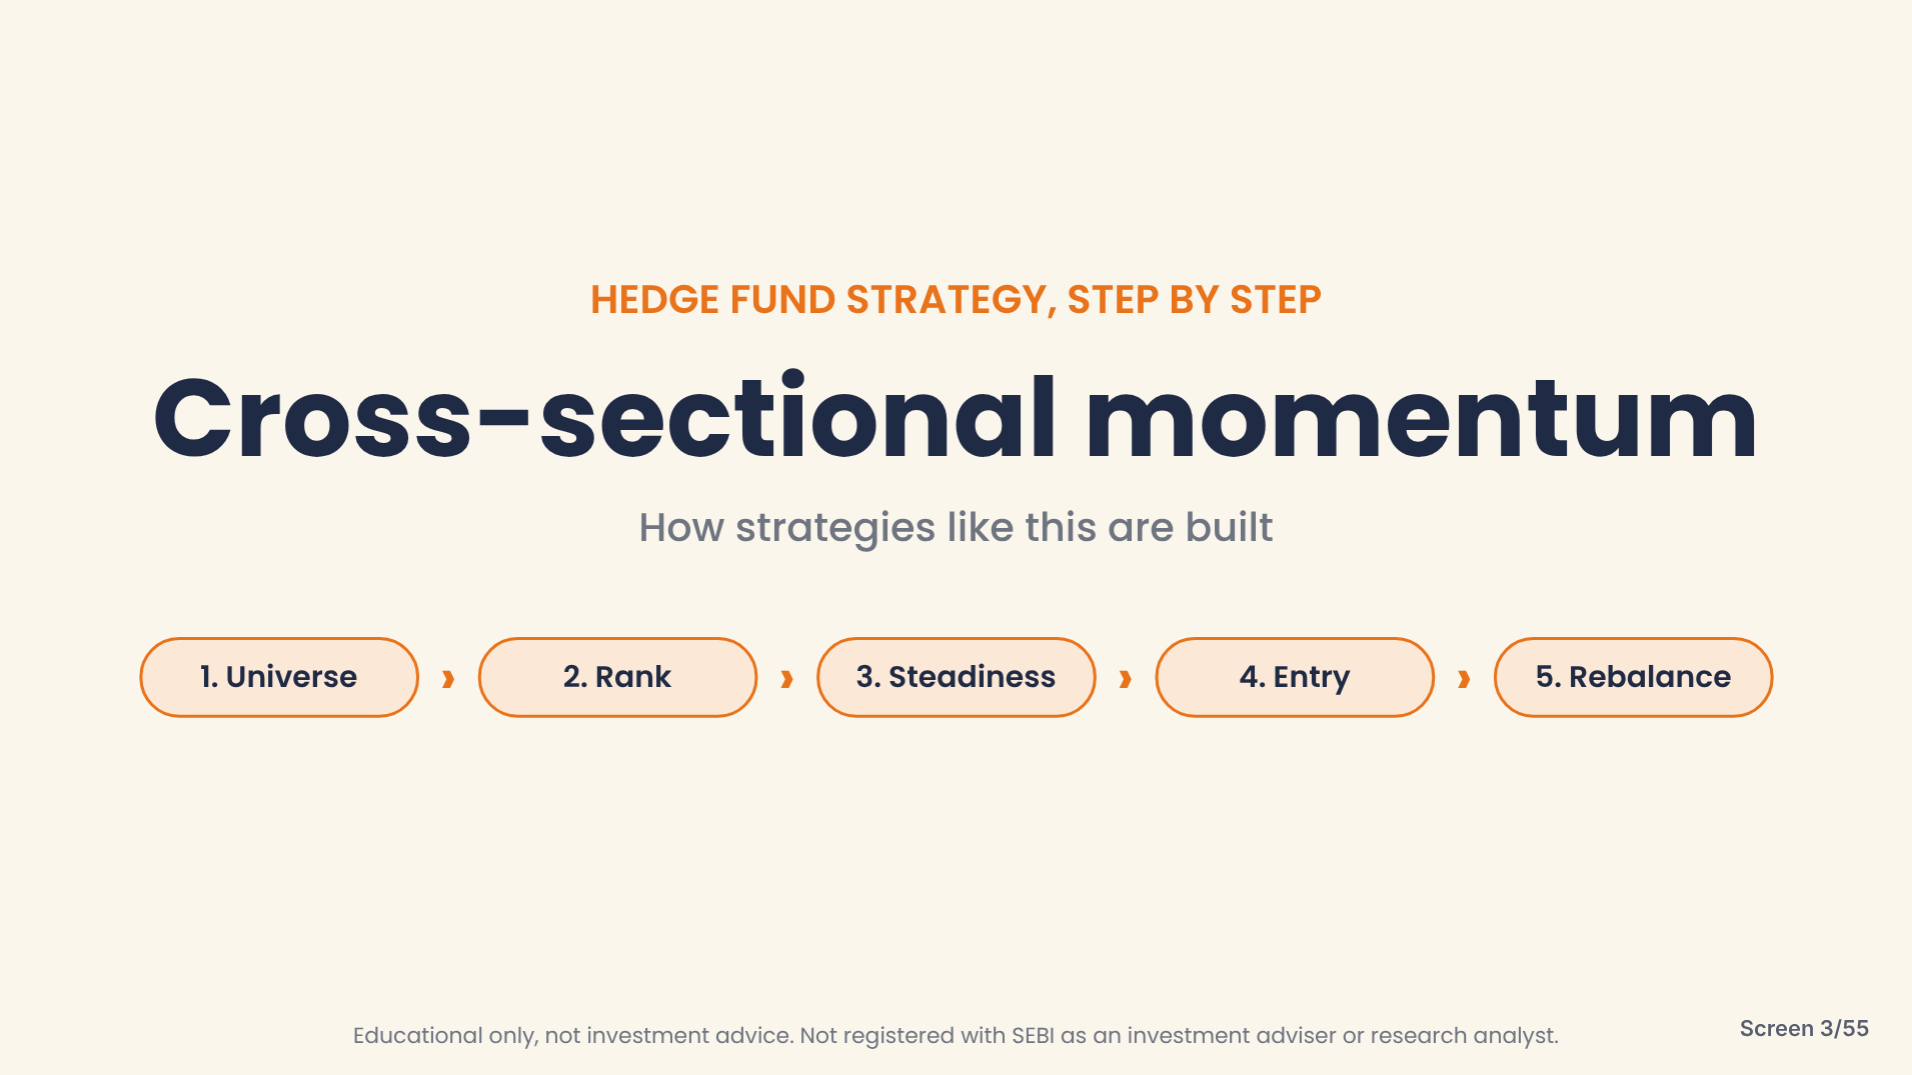
Slide: the five steps of cross-sectional momentum.
Why this matters: both retail traders and funds trade momentum. The difference is the mechanism. A retail trader asks “will this stock go up?” A fund asks “which stocks are moving most steadily, and how do I hold a group of them?”
Step 1: Universe Selection
What to do: Define a group of stocks to work with. Funds running cross-sectional momentum typically work on a group of about 200 stocks. Your group can be the Nifty 50, Nifty F&O, Nifty 500, Bank Nifty, or a basket you build yourself.
Why: the strategy compares stocks against each other. It needs a fixed pool to compare, and a bigger pool gives it a better chance of finding clear winners and losers.
Expected result: a basket of roughly 200 stocks. In the video this is the Nifty F&O list, because we will later trade these stocks through futures.
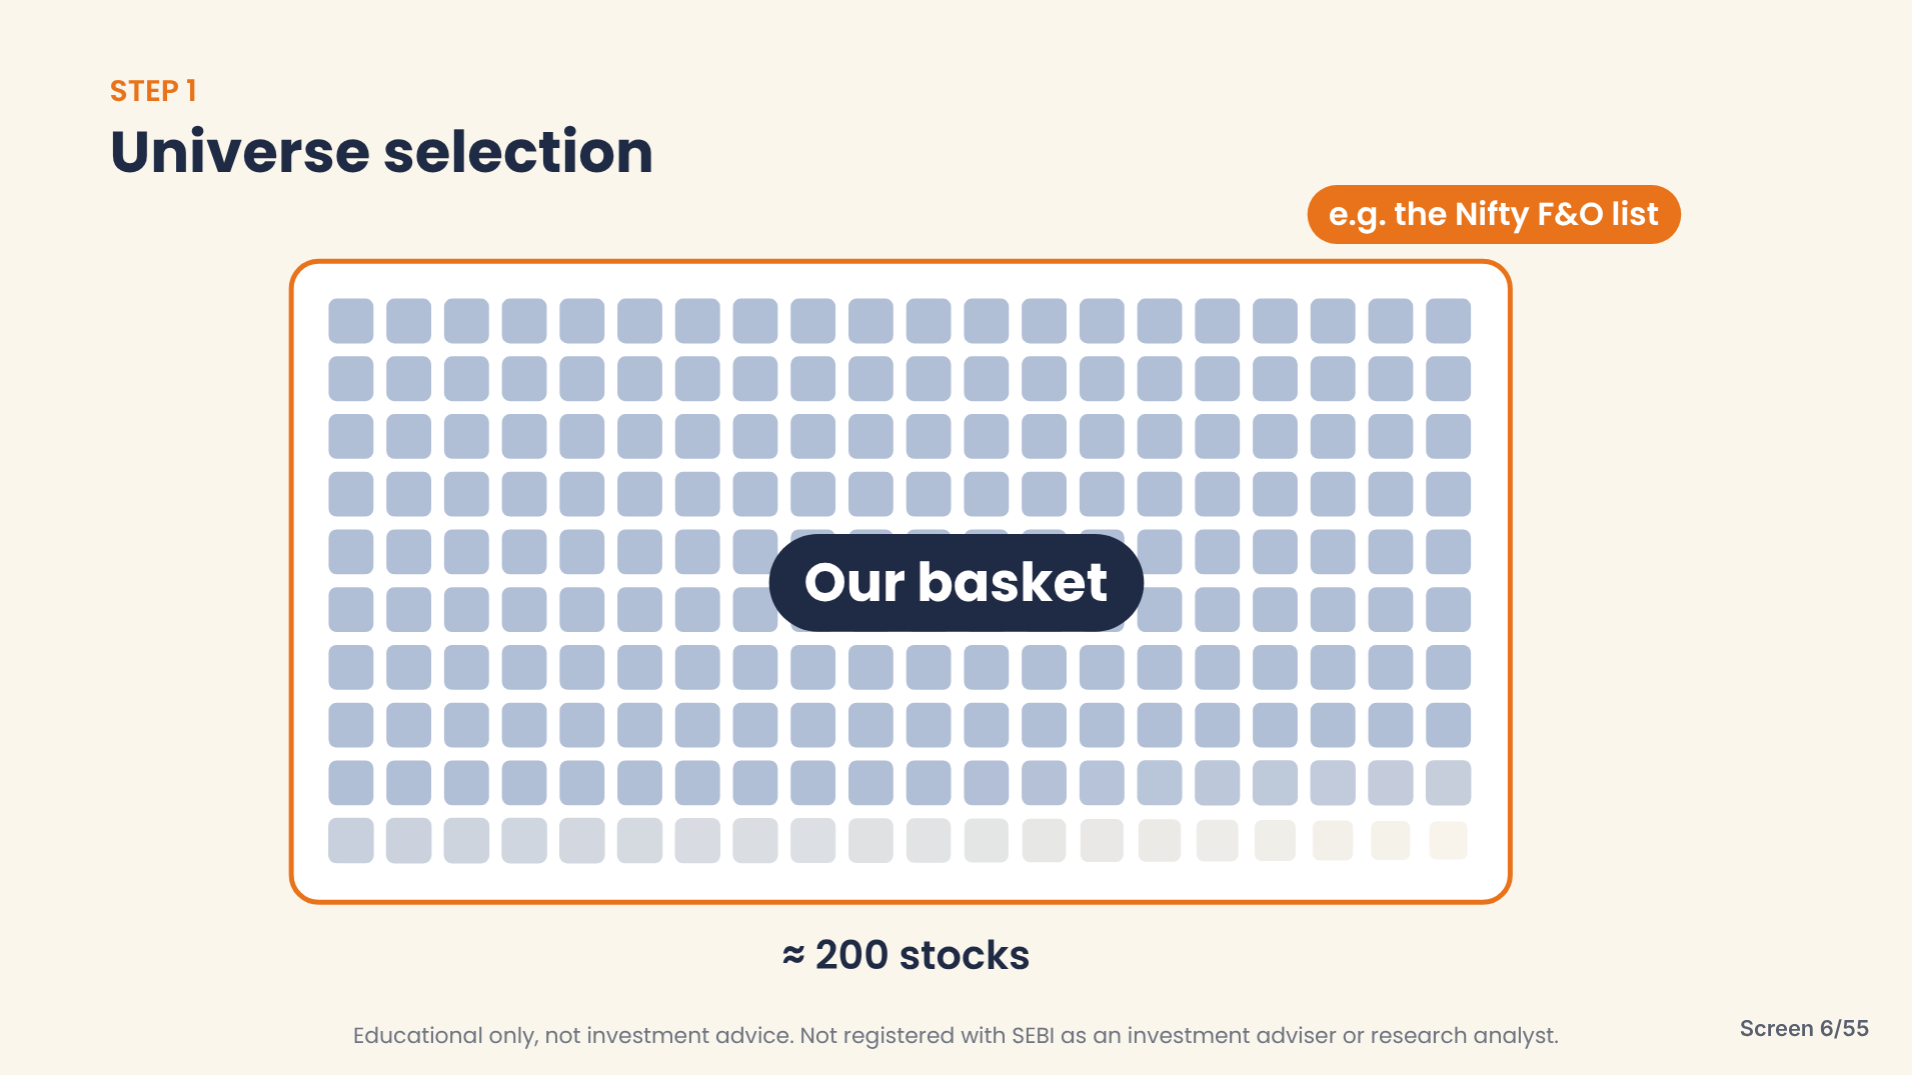
Slide: about 200 stocks form “our basket”.
Step 2: Rank and Group
What to do: Rank every stock in the basket by how much it rose or fell over the last 12 months, but skip the latest month. That means you count the 11 months before the current month. If it is now November, you leave November out.
Why skip the latest month? A stock that just moved sharply can be jumpy the next month. Recent volatility can fake momentum, and one month of noise does not show that the stock has been stable and trending for the past year. The skip is deliberate: funds back-test this choice. We want long-term momentum, so short-term momentum is removed from the equation.
How it works: Sort the whole list. The strongest risers sit at the top and the biggest fallers at the bottom. Take the top 5 (winners) and the bottom 5 (losers).
Expected result: a list of winners and a list of losers.
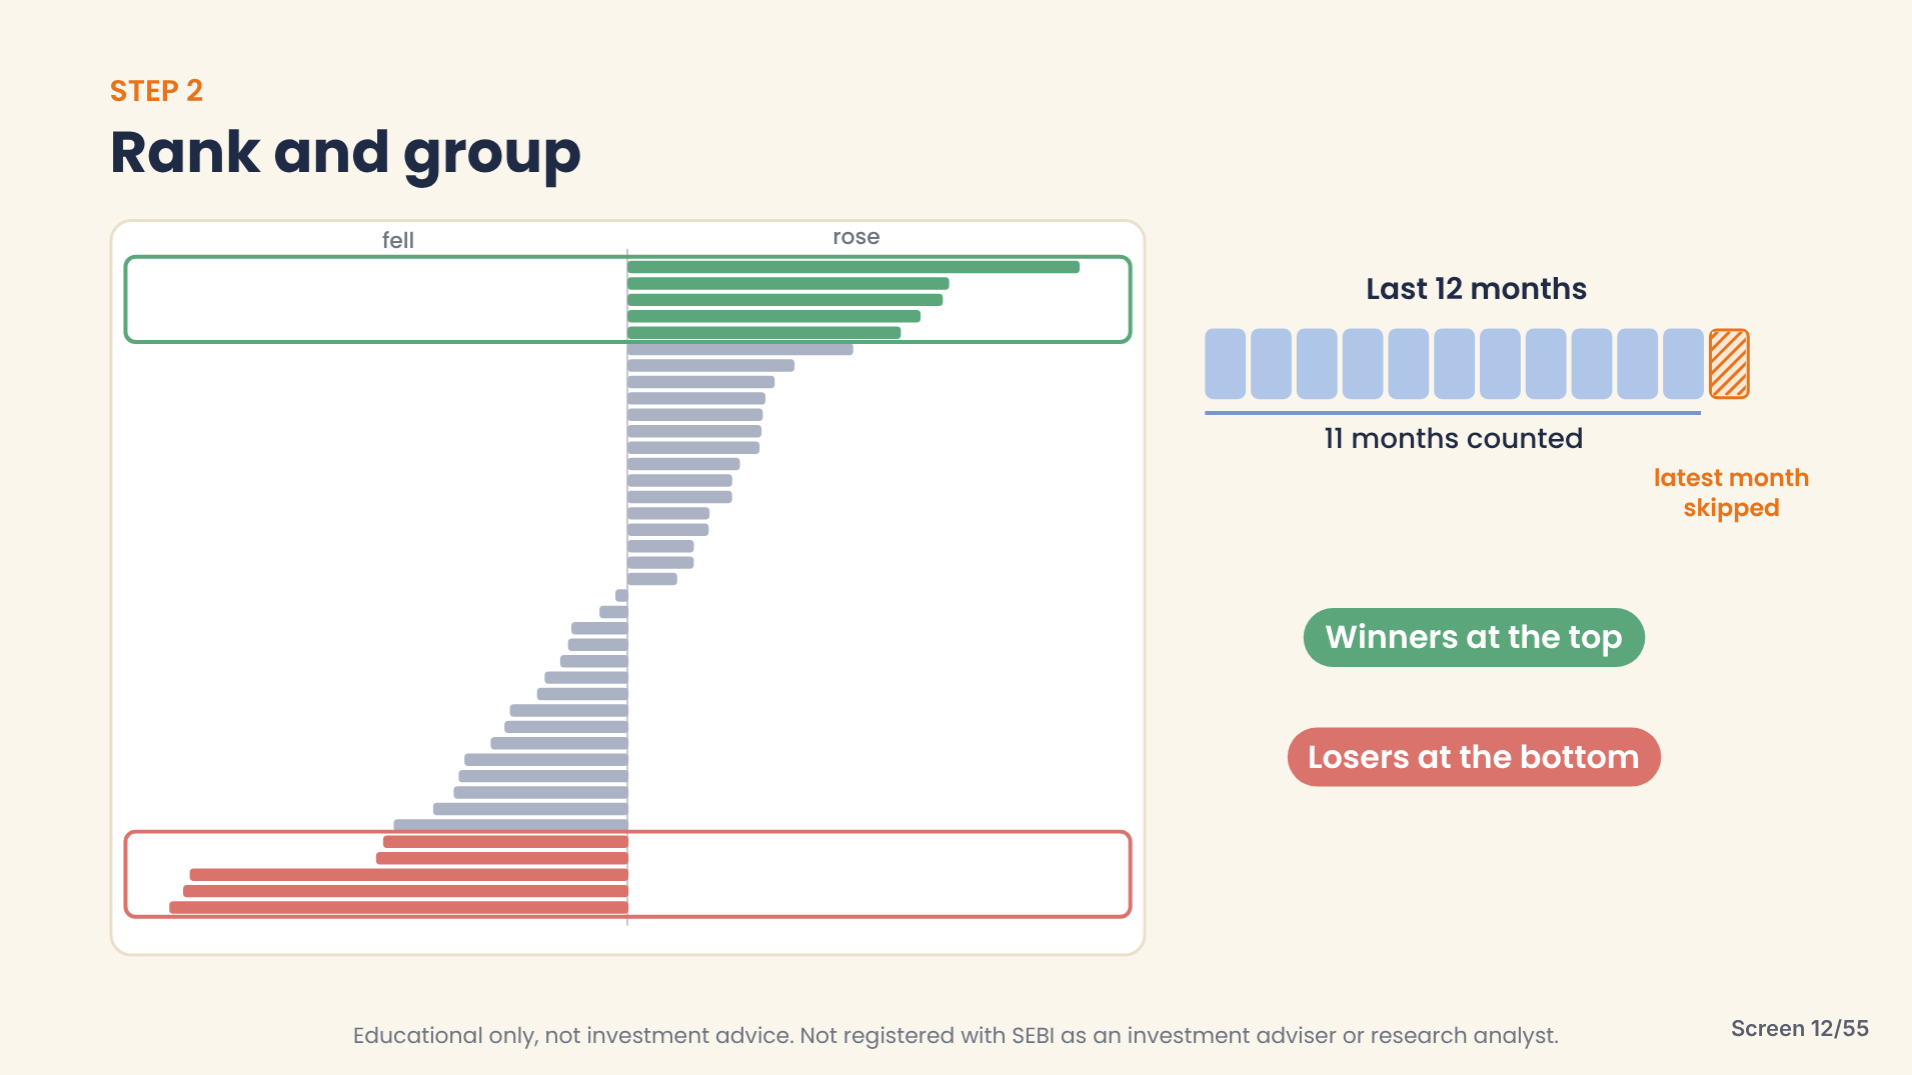
Slide: stocks sorted by 12-month rise, with the latest month skipped.
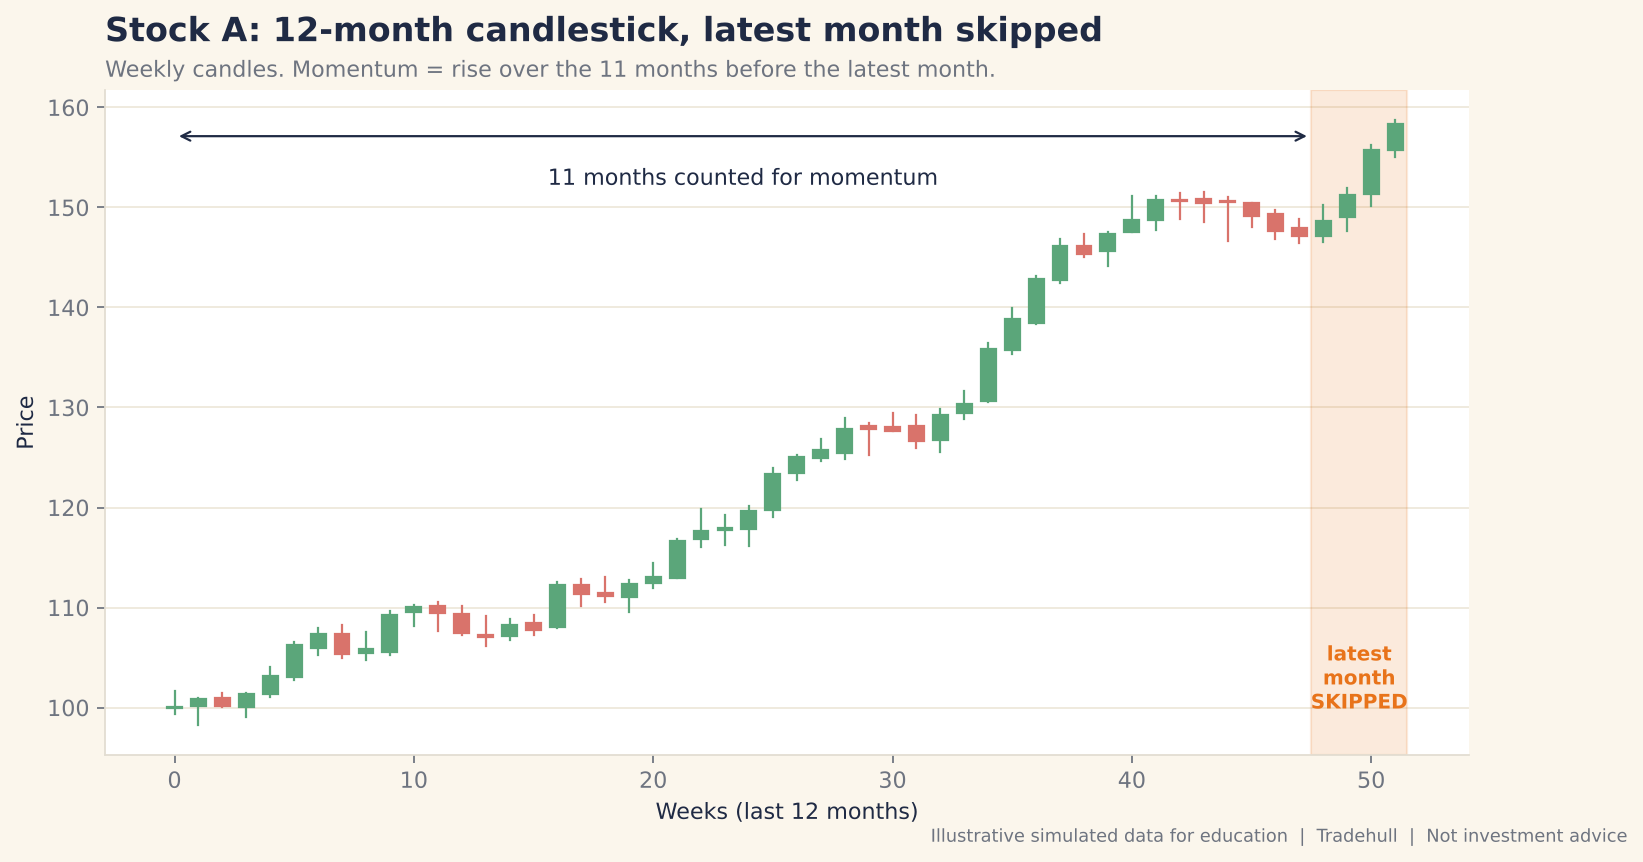
Illustrative chart: weekly candles for a stock. The orange band is the latest month, which is skipped.
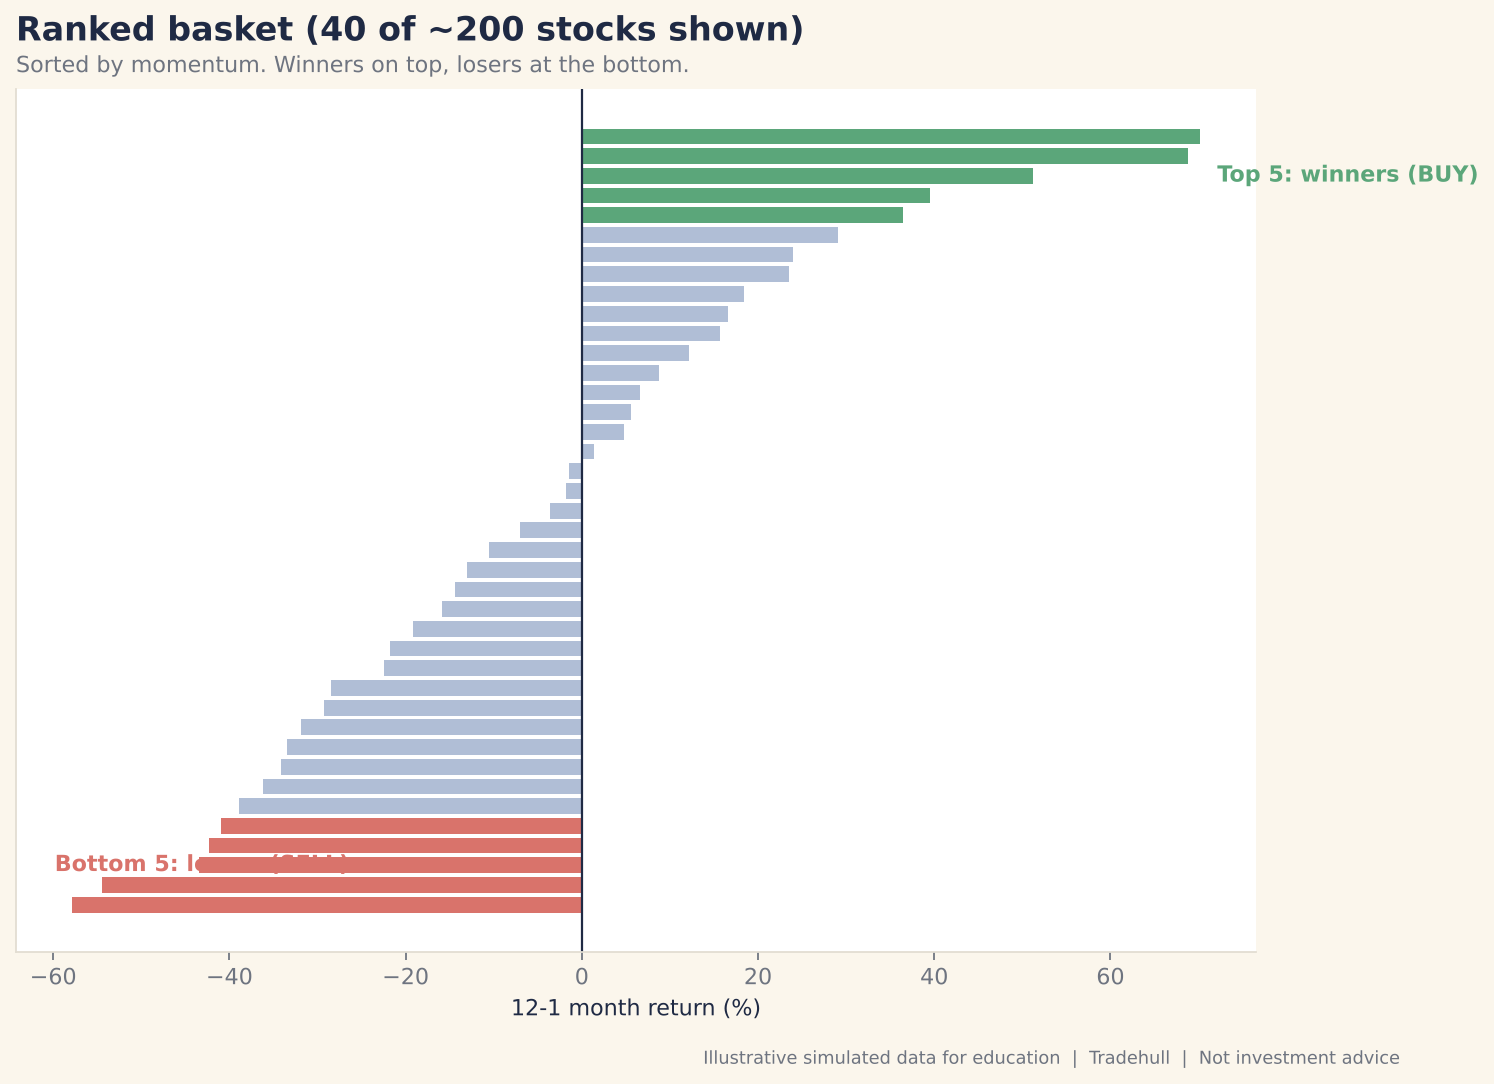
Illustrative chart: the ranked basket. Green is the top 5, red is the bottom 5.
Tip: The rule is “12 months, minus the latest month”. Do not shorten it to “last month’s movers”. That is the opposite idea.
Step 3: Re-rank for Steadiness
What to do: Rank the winners and losers again, this time on how steadily they moved.
Why: Two stocks can rise by a similar amount over the year. One climbs steadily, week after week. The other makes most of its move in one jumpy gap, perhaps one lucky day. Hedge funds say: we do not want jumpy stocks. We want stocks that move calmly in one direction for a long time.
How it works: The jumpy stock gets a lower rank and the steady one moves up. The same applies on the losing side. We want steady winners and steady losers, ones that fall gradually and consistently, not ones that crashed in one session.
Expected result: a portfolio of steady movers. A retail trader who only looks at momentum might enter the jumpy one because “it went up”. The fund’s rule rejects it.
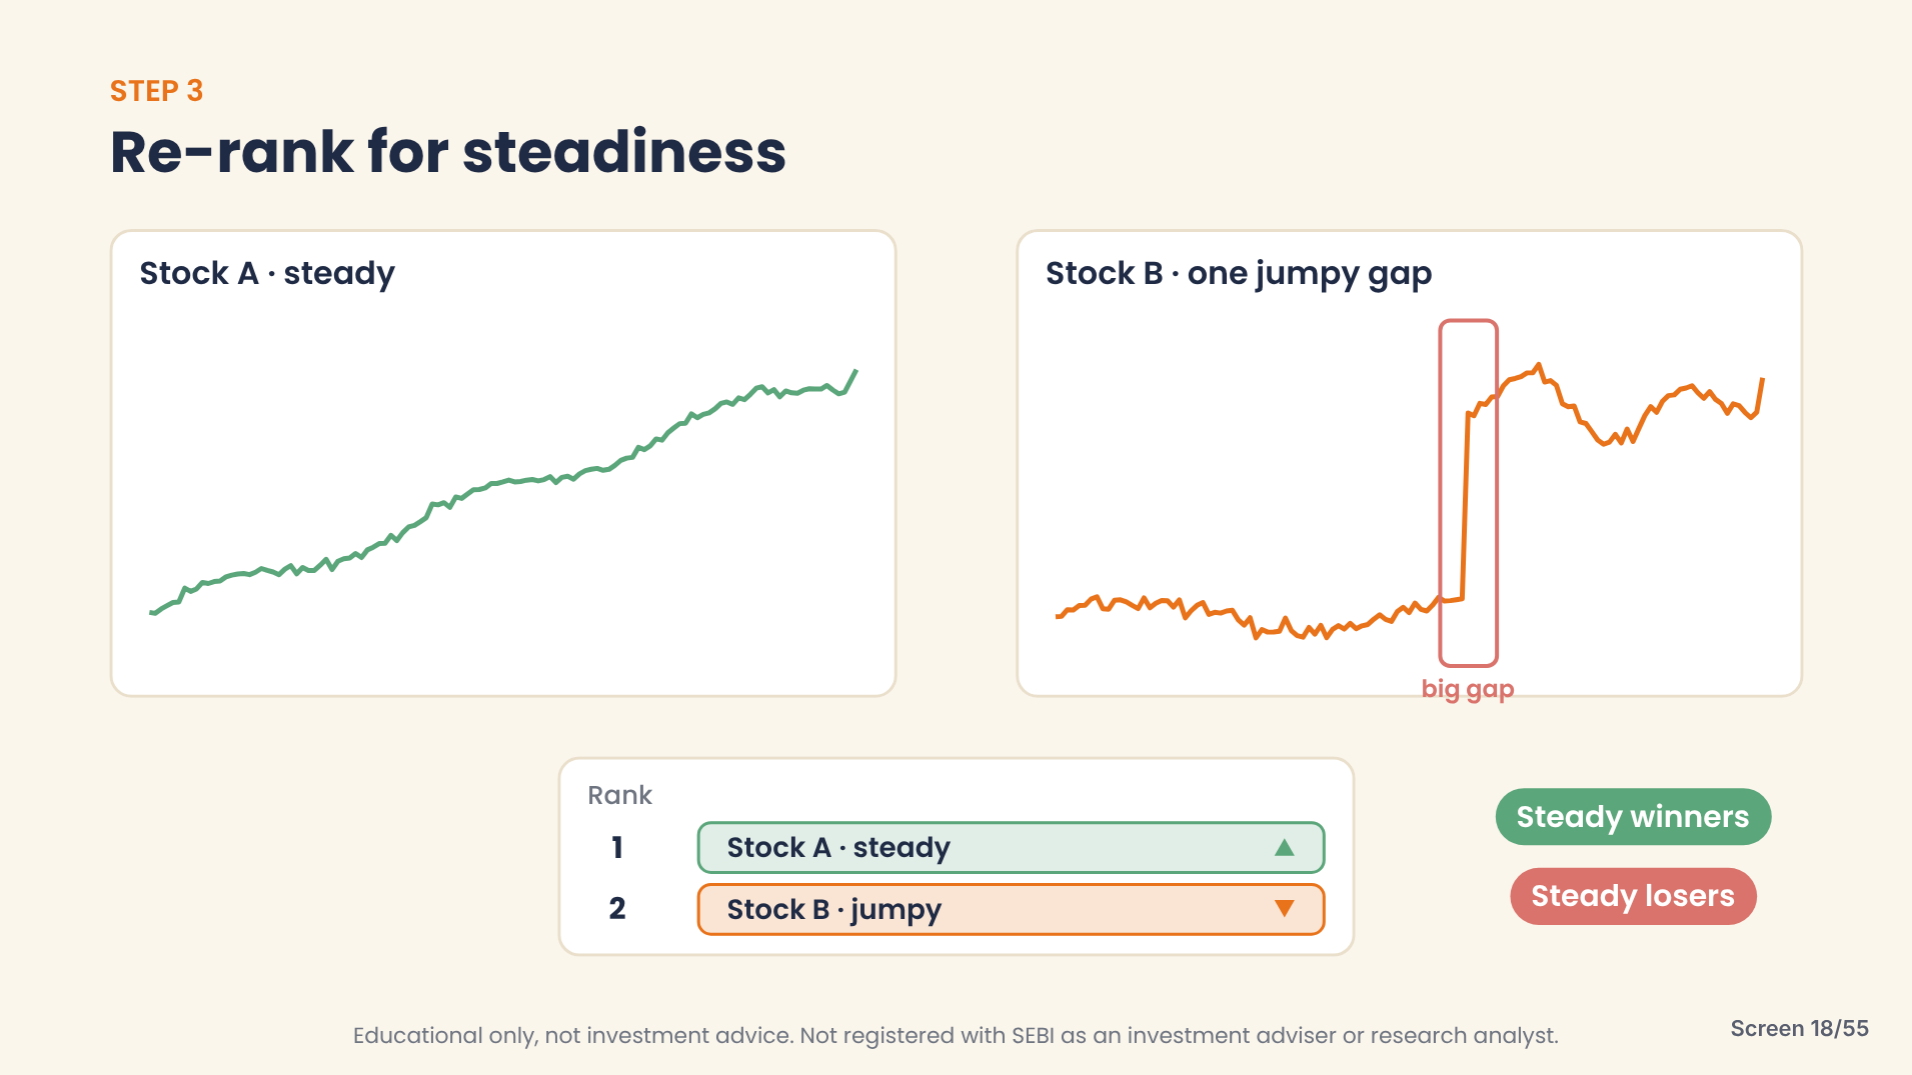
Slide: Stock A climbs steadily. Stock B makes most of its move in one gap, so it is ranked lower.
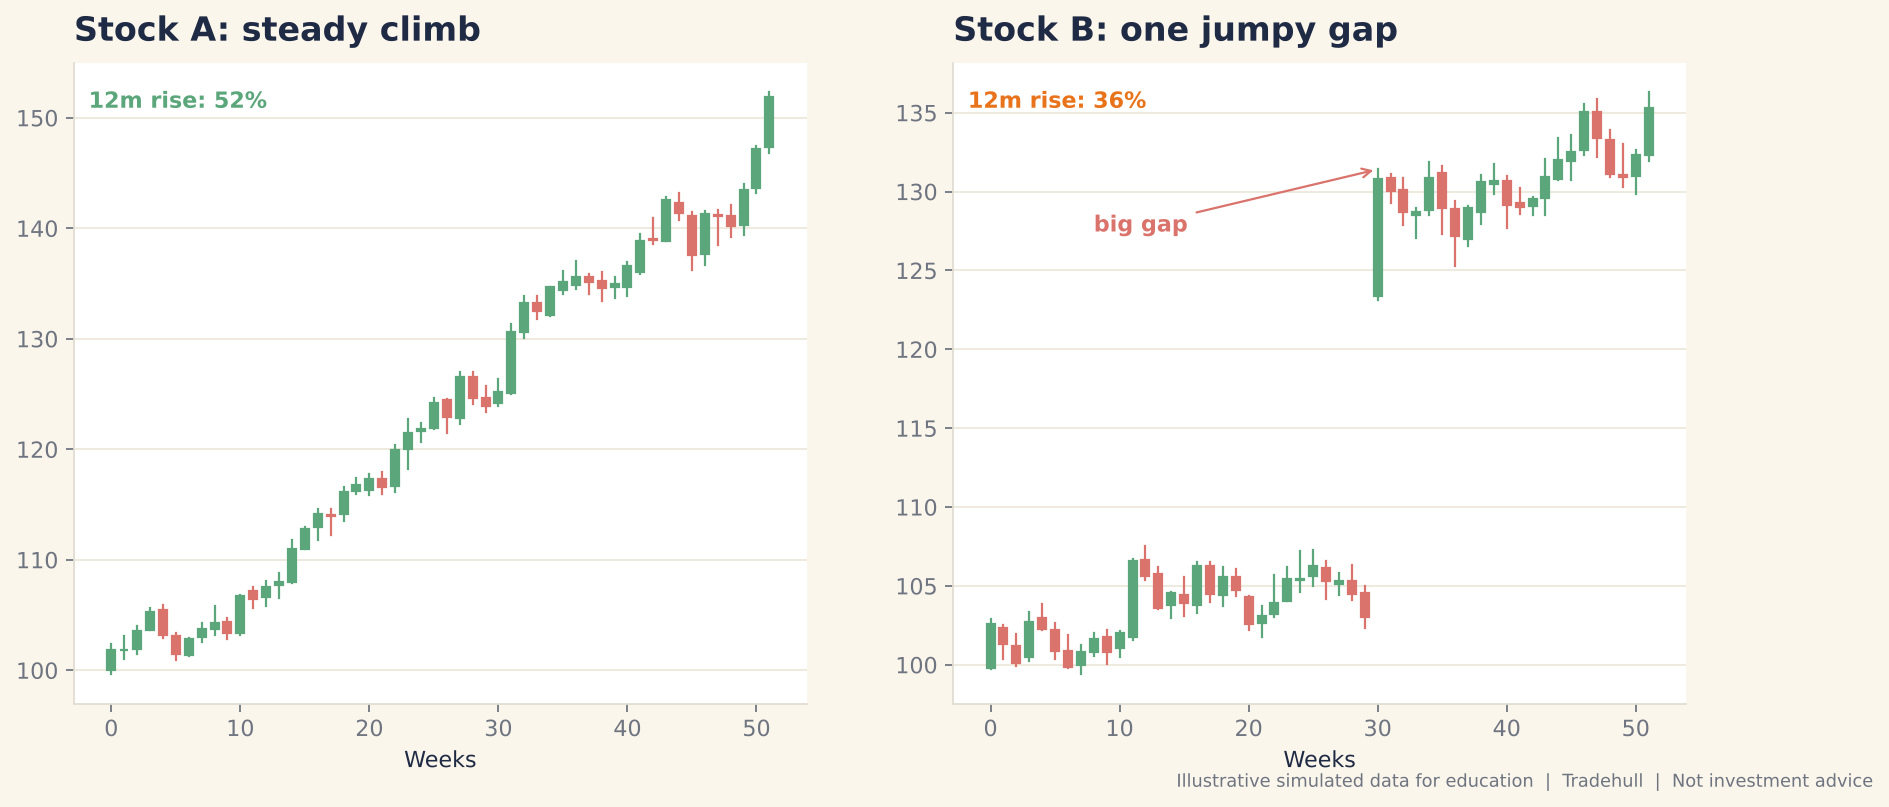
Illustrative chart: both stocks rise, but only Stock A rises steadily.
Step 4: Entry
What to do: Buy the top 5 stocks in futures and sell the bottom 5 stocks in futures.
Why a group? A fund never says “I want to buy HDFC Bank”. It builds a bunch of stocks and buys the bunch. This reduces stock-specific risk. If one of the five has a legal problem and falls, the other four still support the bullish side. If one of the five sold stocks gets good news and reverses, the others still support the bearish side.
What the name means:
| Word | Meaning |
|---|---|
| Cross-section | Compare stocks against each other, at the same time |
| Momentum | Back the ones that are moving steadily |
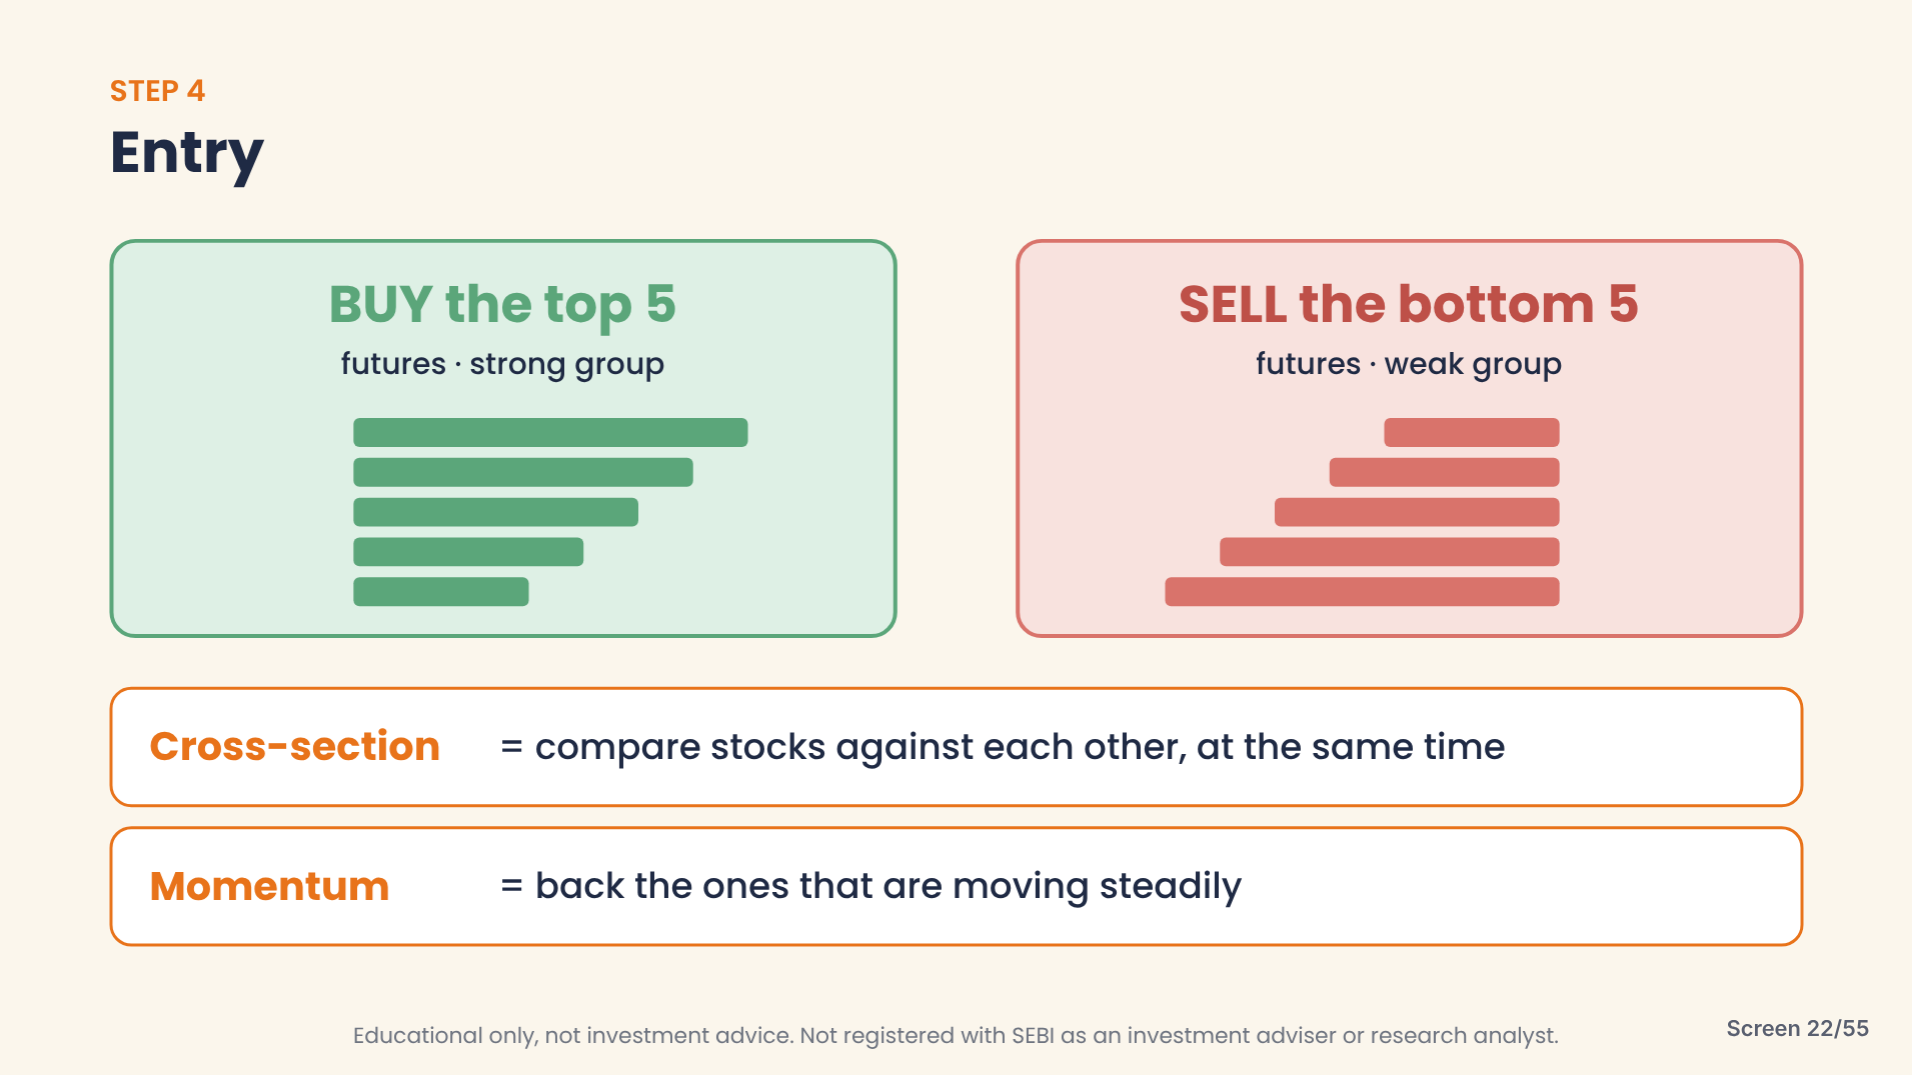
Slide: BUY the strong group, SELL the weak group, both in futures.
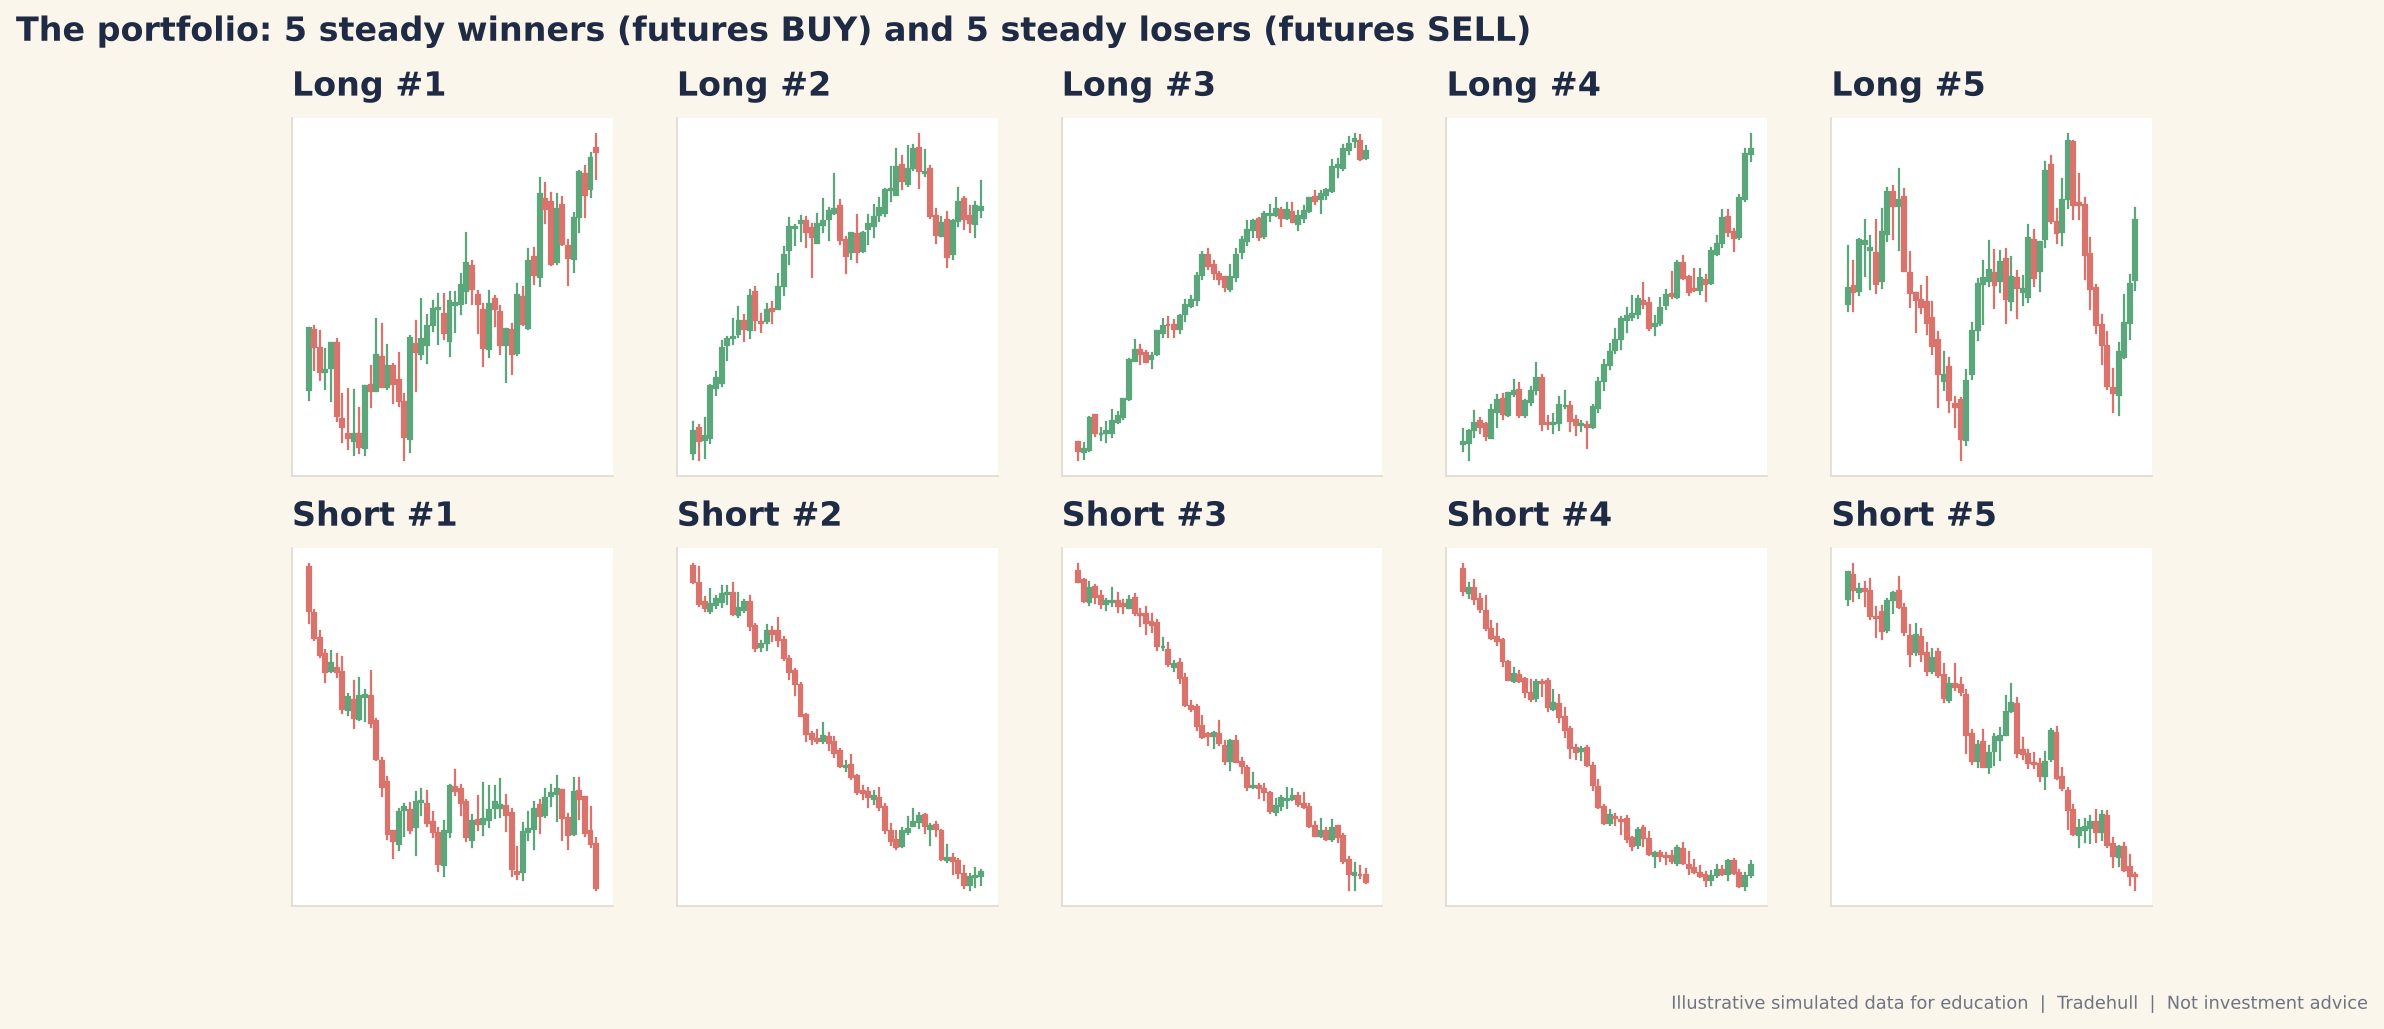
Illustrative chart: five steady winners on top, five steady losers below.
Why This Strategy Doesn’t Bet on Direction
As retail traders we usually hold a view: bullish or bearish. This strategy has no view. It is long the strong group and short the weak group, so it is hedged against the market’s movement. It is similar in spirit to how we hedge when selling options.
What it trades: the spread, the gap between the strong group and the weak group.
Spread = strong group (long) − weak group (short)
The video shows three example markets. These are only example numbers to show the idea.
| Market | Strong group (long) | Weak group (short) | Spread |
|---|---|---|---|
| Market gaps up | +100 points | +30 points | 70 points |
| Market falls | −50 points | −130 points | 80 points |
| Sideways | +30 points | −40 points | 70 points |
- Gap up: the strong group gains 100. The weak group also bounces by 30, which costs us on the short side. Net: 70.
- Market falls: the weak group was already bearish and falls 130. The strong group resists and falls only 50. Net: 80.
- Sideways: the strong group drifts up 30 and the weak group slips 40. Net: 70.
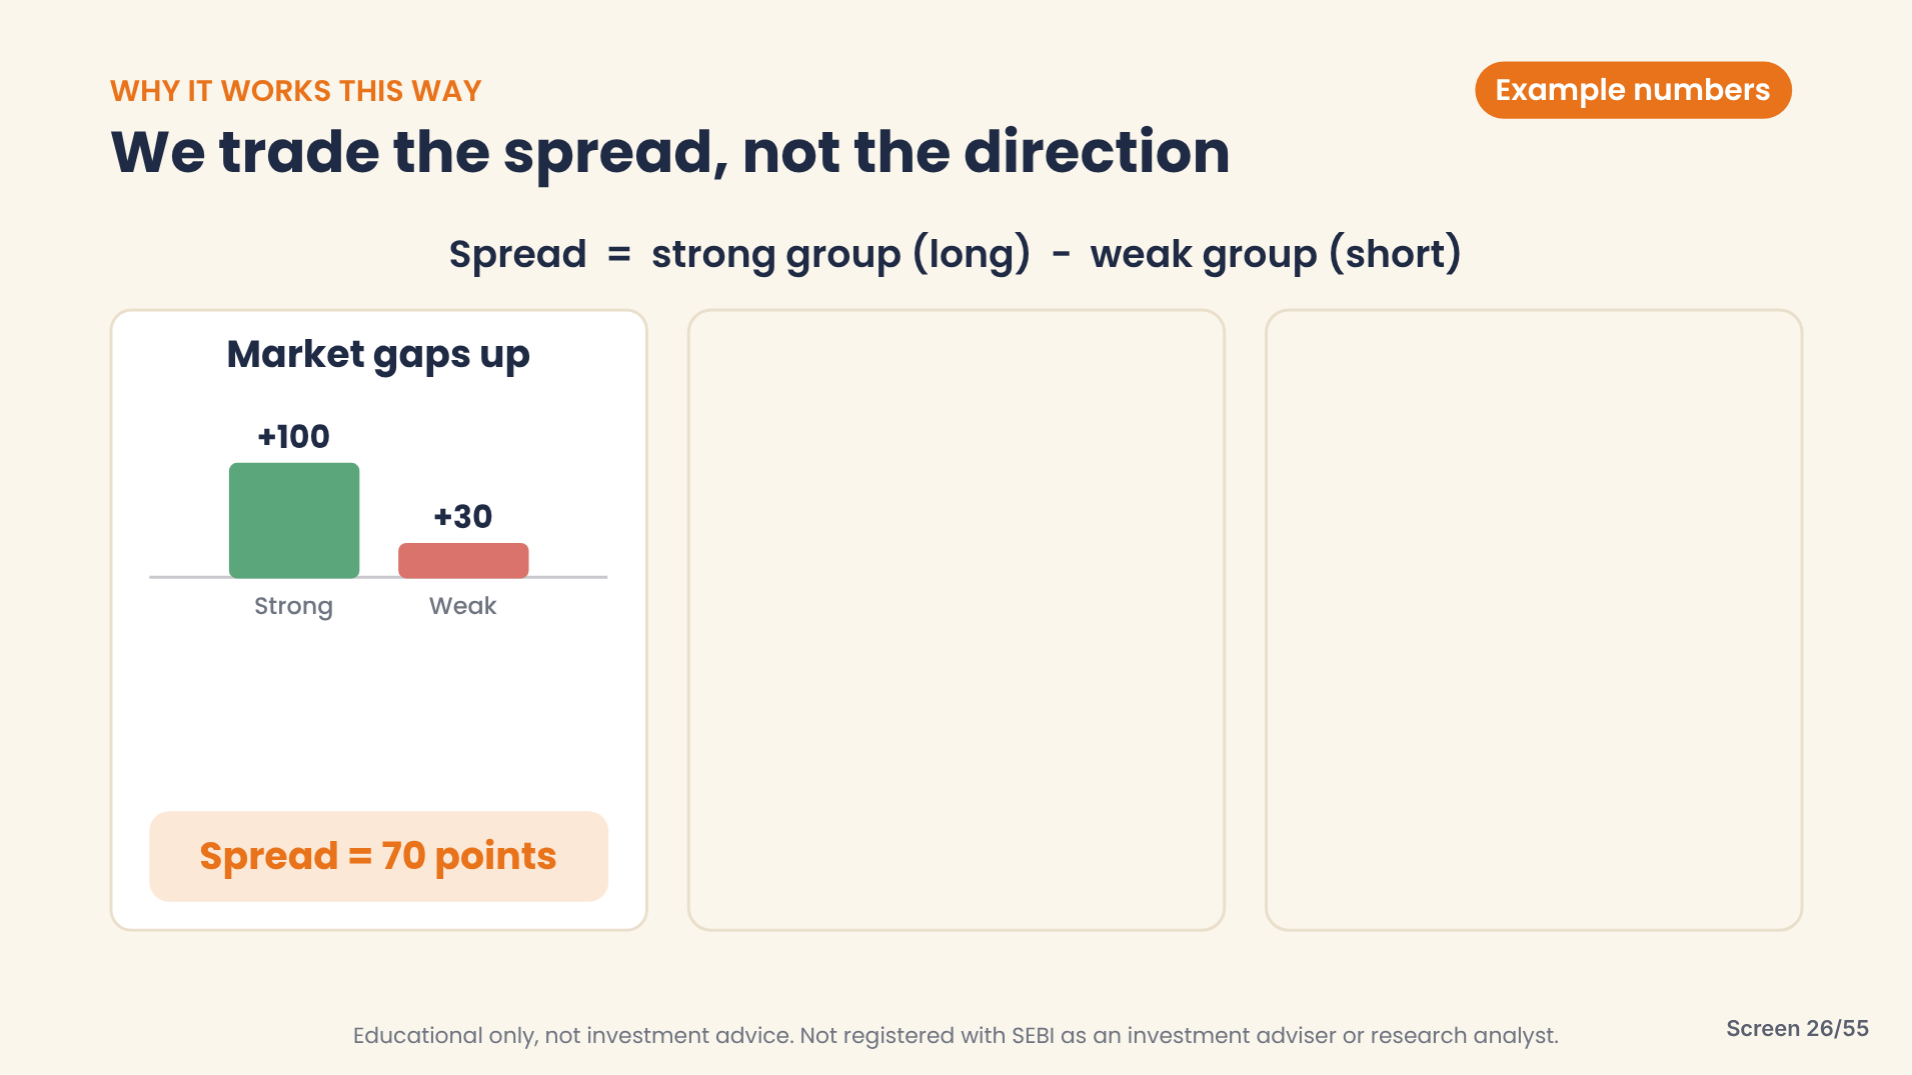
Slide: market gaps up.
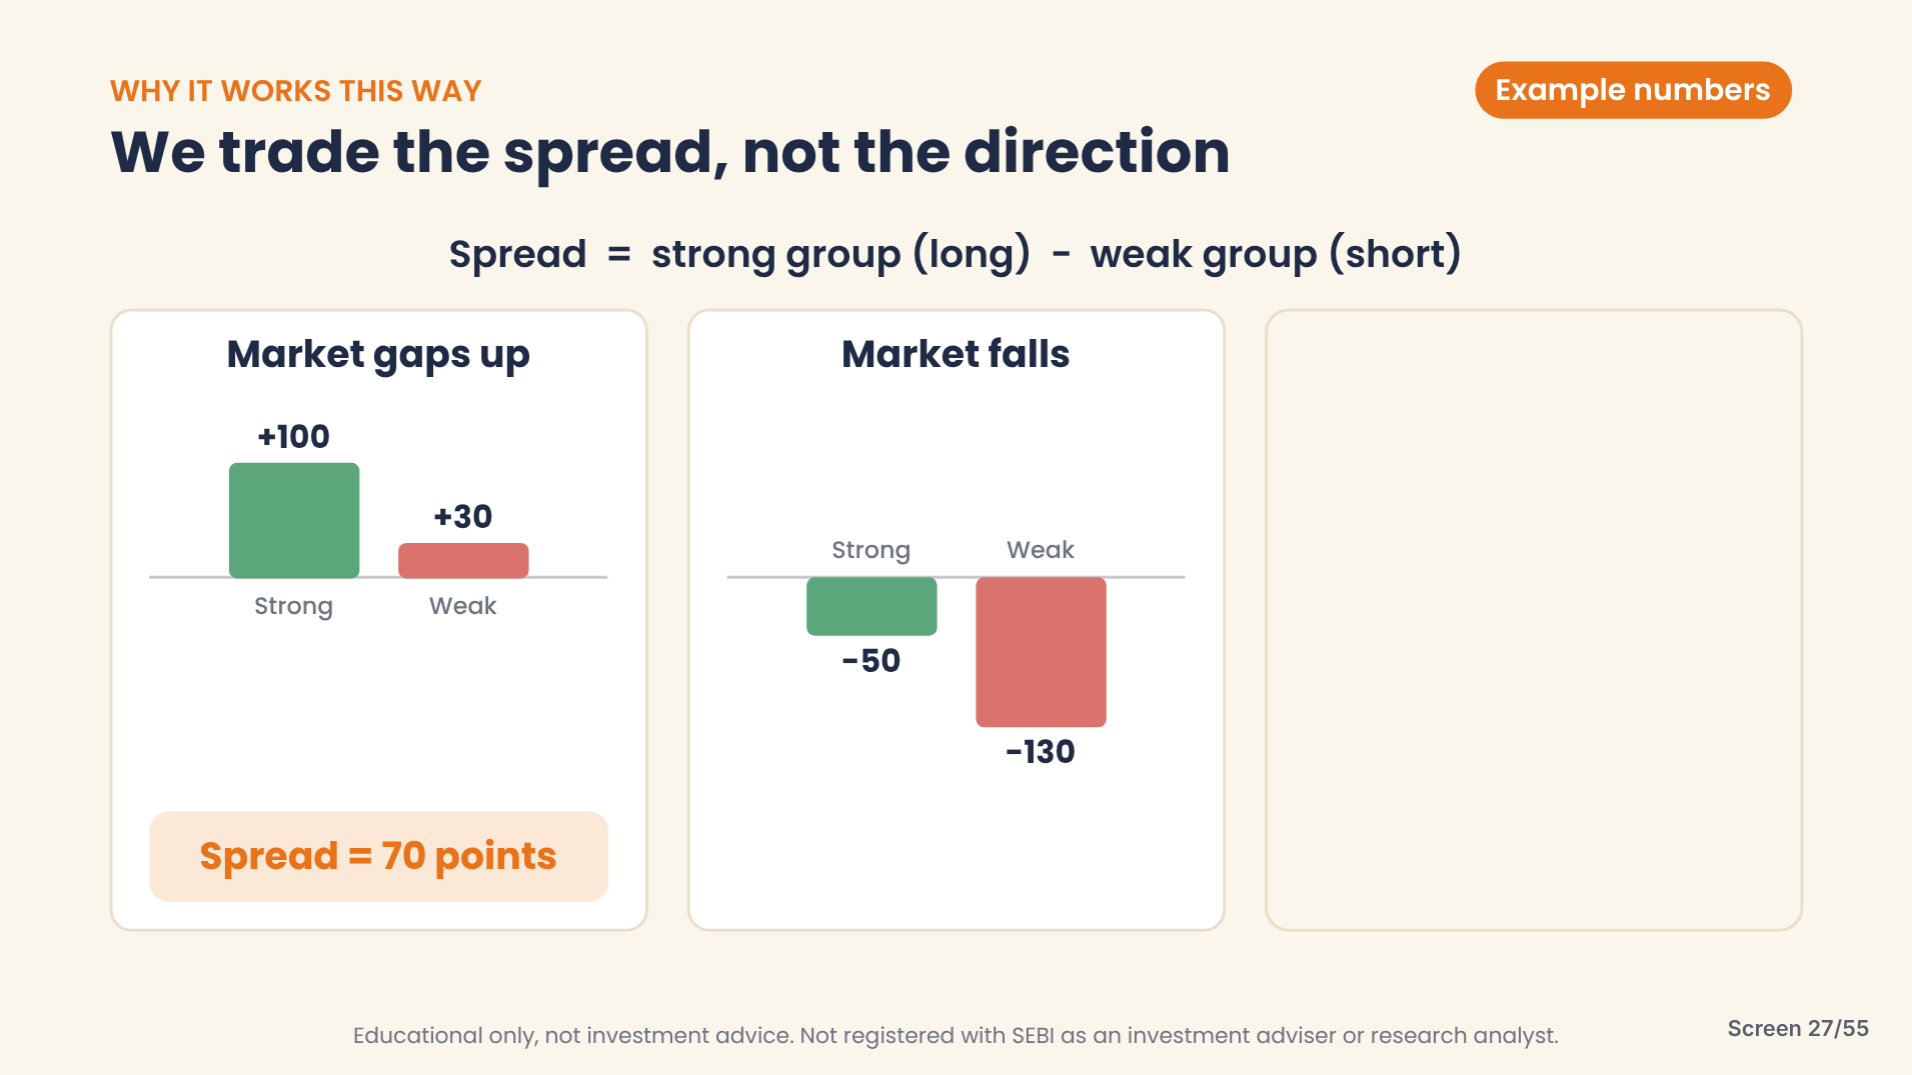
Slide: market falls.
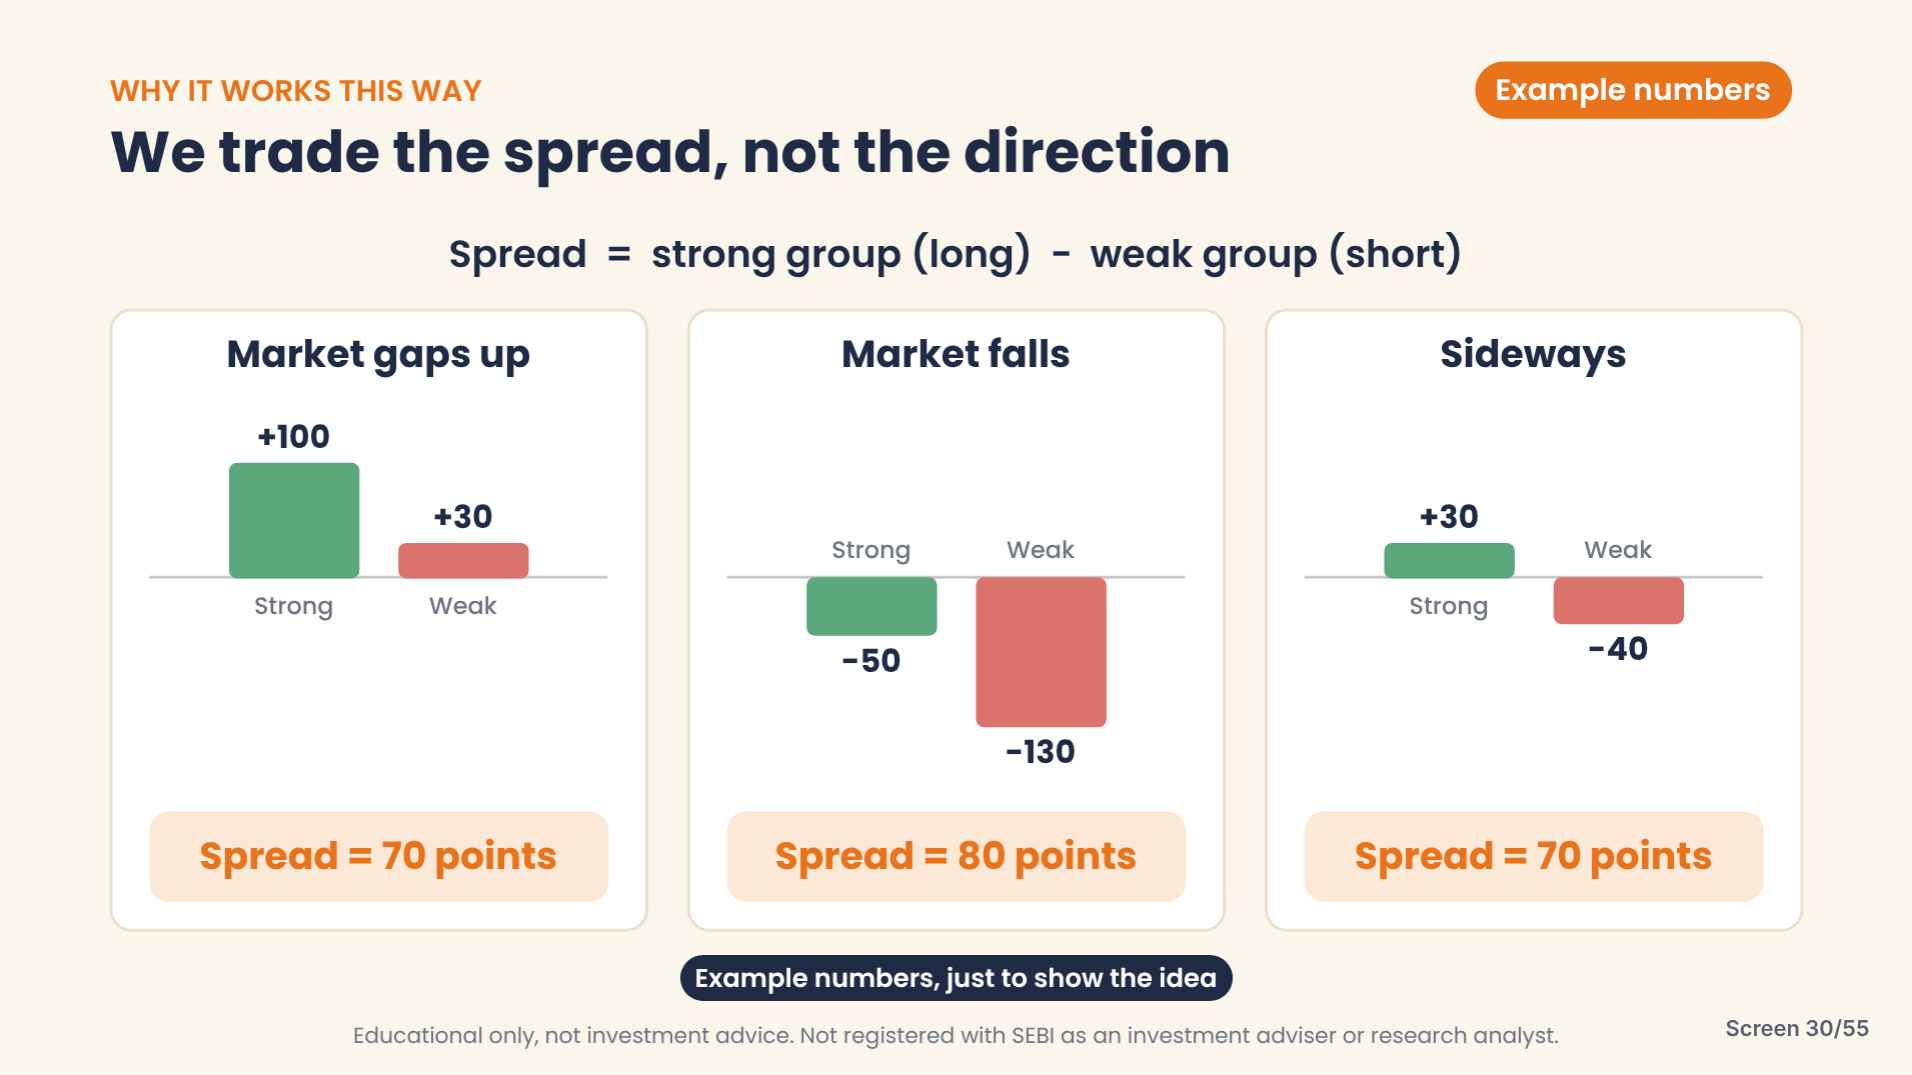
Slide: the spread stays positive in all three markets.
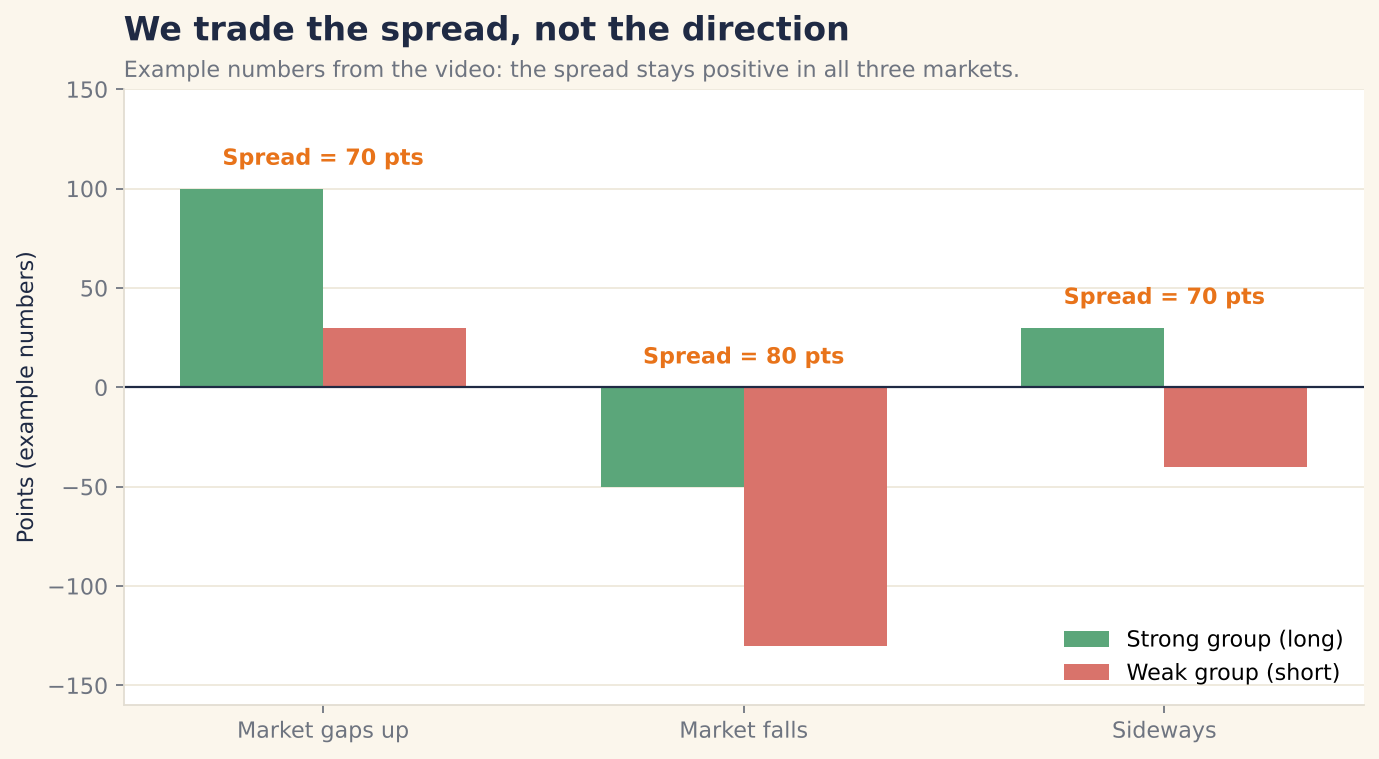
Chart: the same example numbers as a bar chart.
The takeaway: we are not predicting direction. We build two groups and trade the difference in momentum between them.
The Risk: A Sharp Fall Followed by a V-Shaped Rebound
Where does this strategy hurt? In a sharp fall followed by a hard, V-shaped rebound. In the rebound, the beaten-down weak group can bounce the hardest. We are short that group, so the short side gets hurt, and that is where the loss comes from.
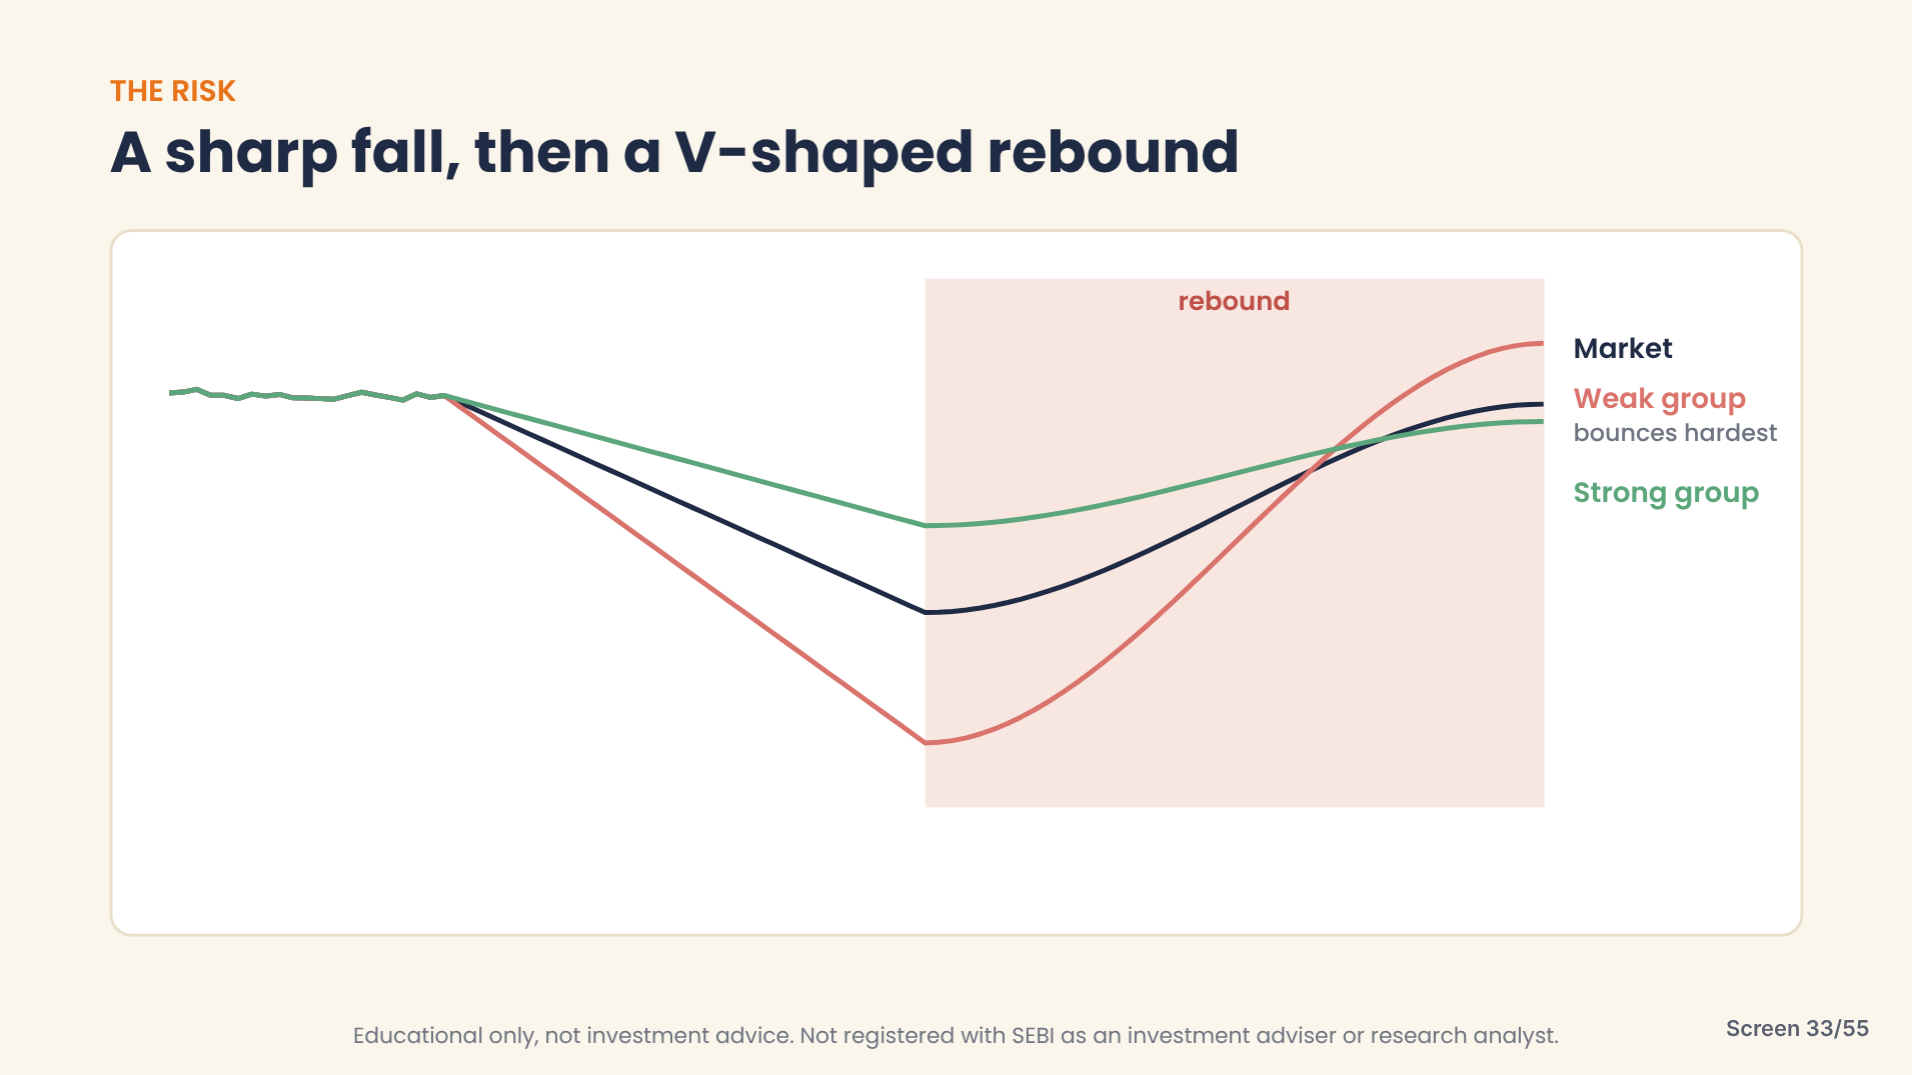
Slide: the weak group (red) rebounds more than the strong group (green).
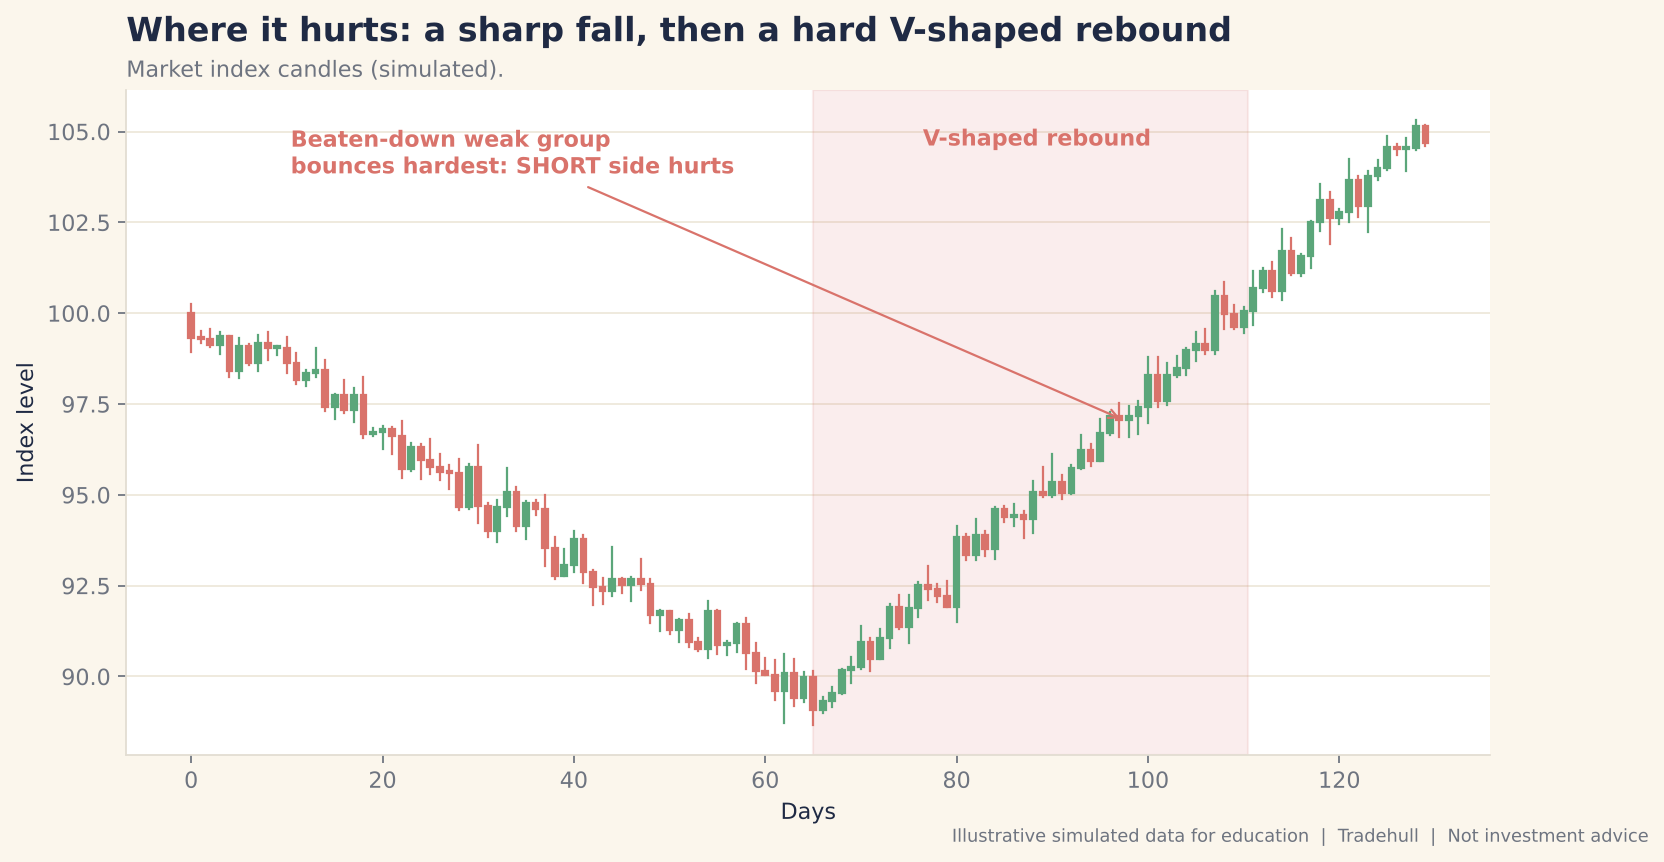
Illustrative chart: a sharp fall, then a V-shaped rebound.
Warning: Strategy-level risk is real. Funds apply a stop at the strategy level, for example stopping the strategy if it loses 6% or 12%. Decide your own limit before you start.
Step 5: Exit = Monthly Rebalance
What to do: Hold the portfolio for a month. Then re-rank everyone. Stocks whose rank has fallen sharply go out, and new strong ones come in. Stocks that still carry their momentum stay.
Why: there is no stop loss and no target at the trade level, unlike our usual strategies. A stop loss and target can exist, but at the strategy level. The exit is the rebalance.
How it works: think of the Nifty 50. Some stocks enter, some leave, and the index continues. This is portfolio management, not one-off trading.
Expected result: about four trades a month, so brokerage and transaction tax stay low, and the strategy needs very little maintenance. It could be run automatically on Dhan Cloud.
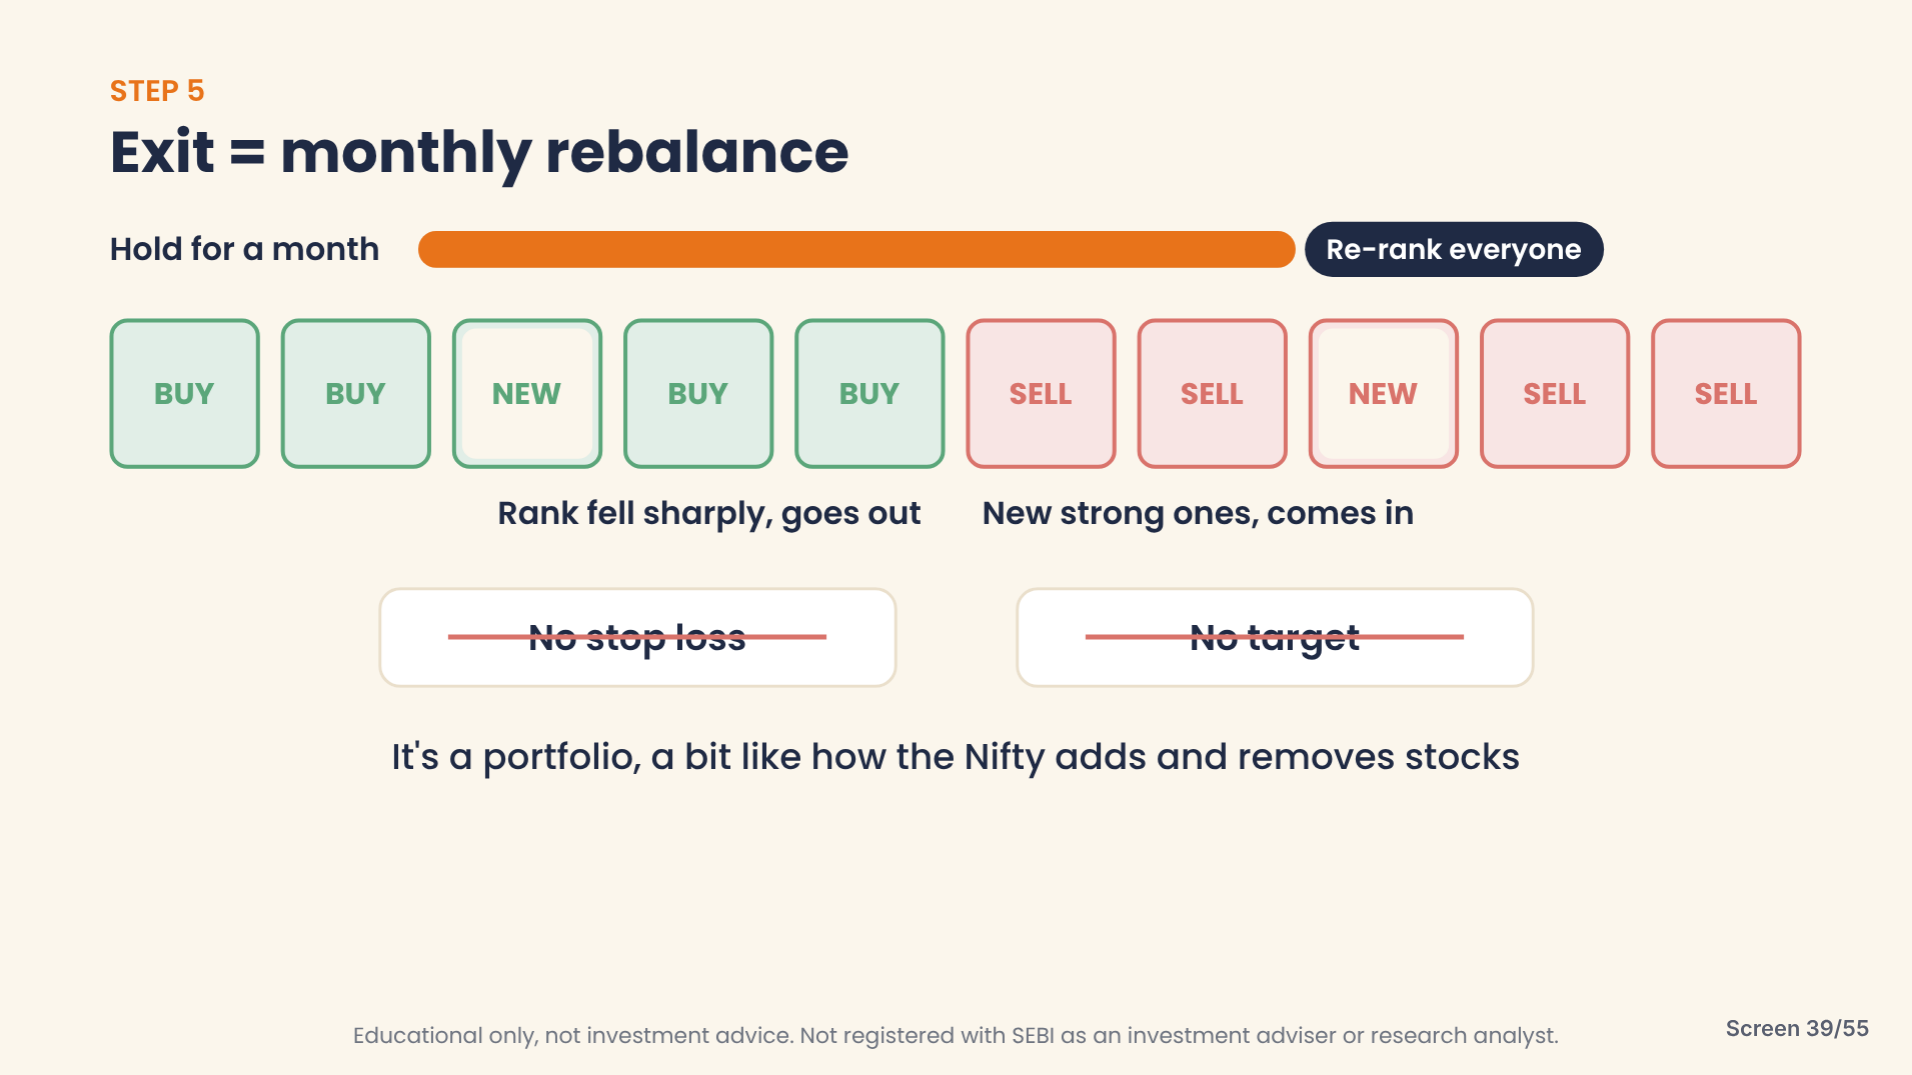
Slide: hold for a month, then re-rank. Stocks that lost momentum go out, new ones come in.
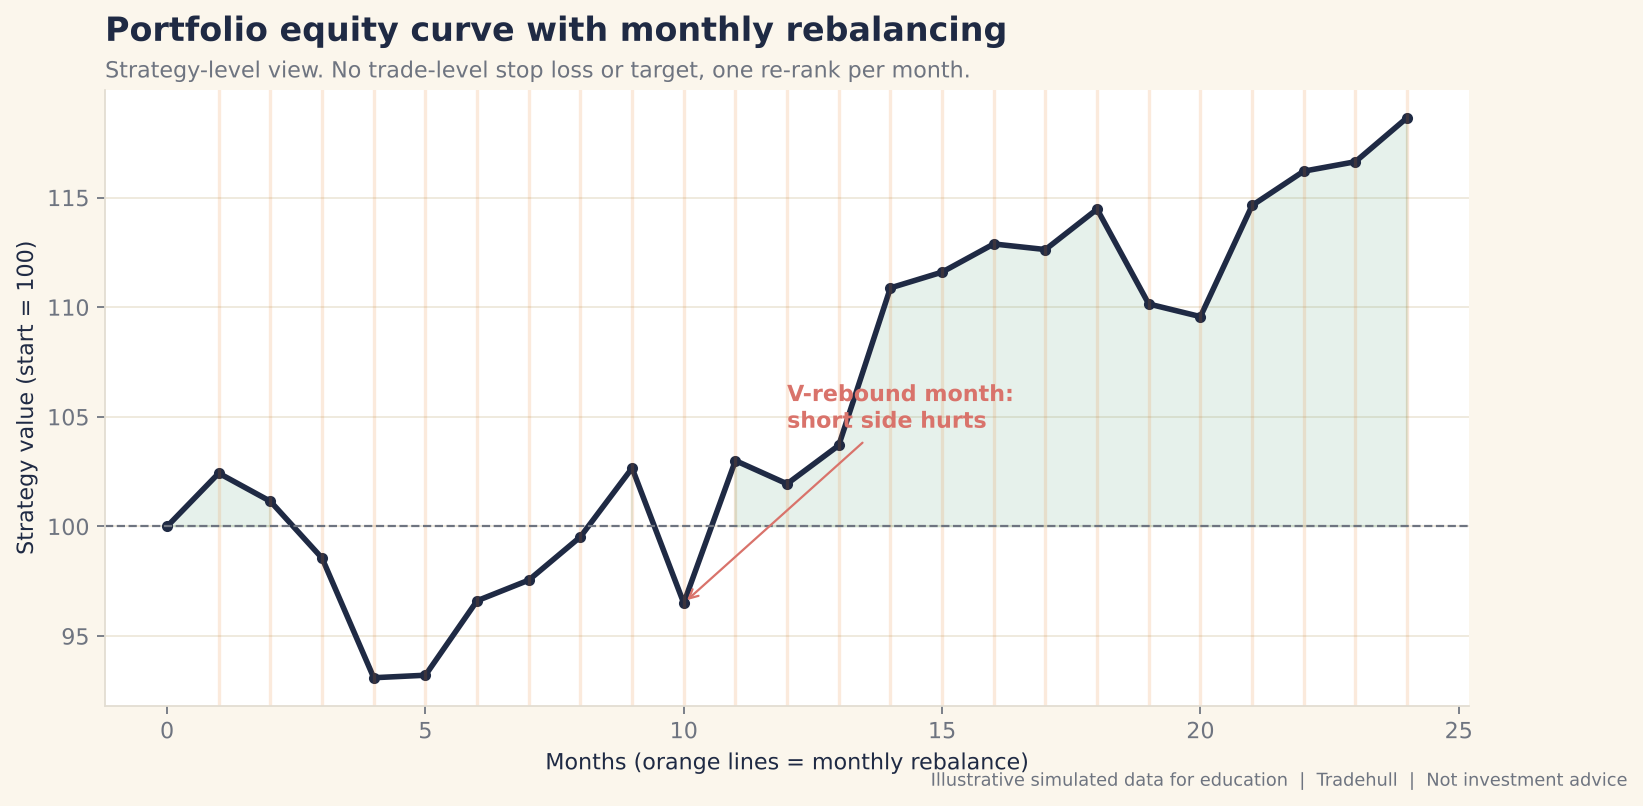
Illustrative chart: portfolio value with one rebalance each month.
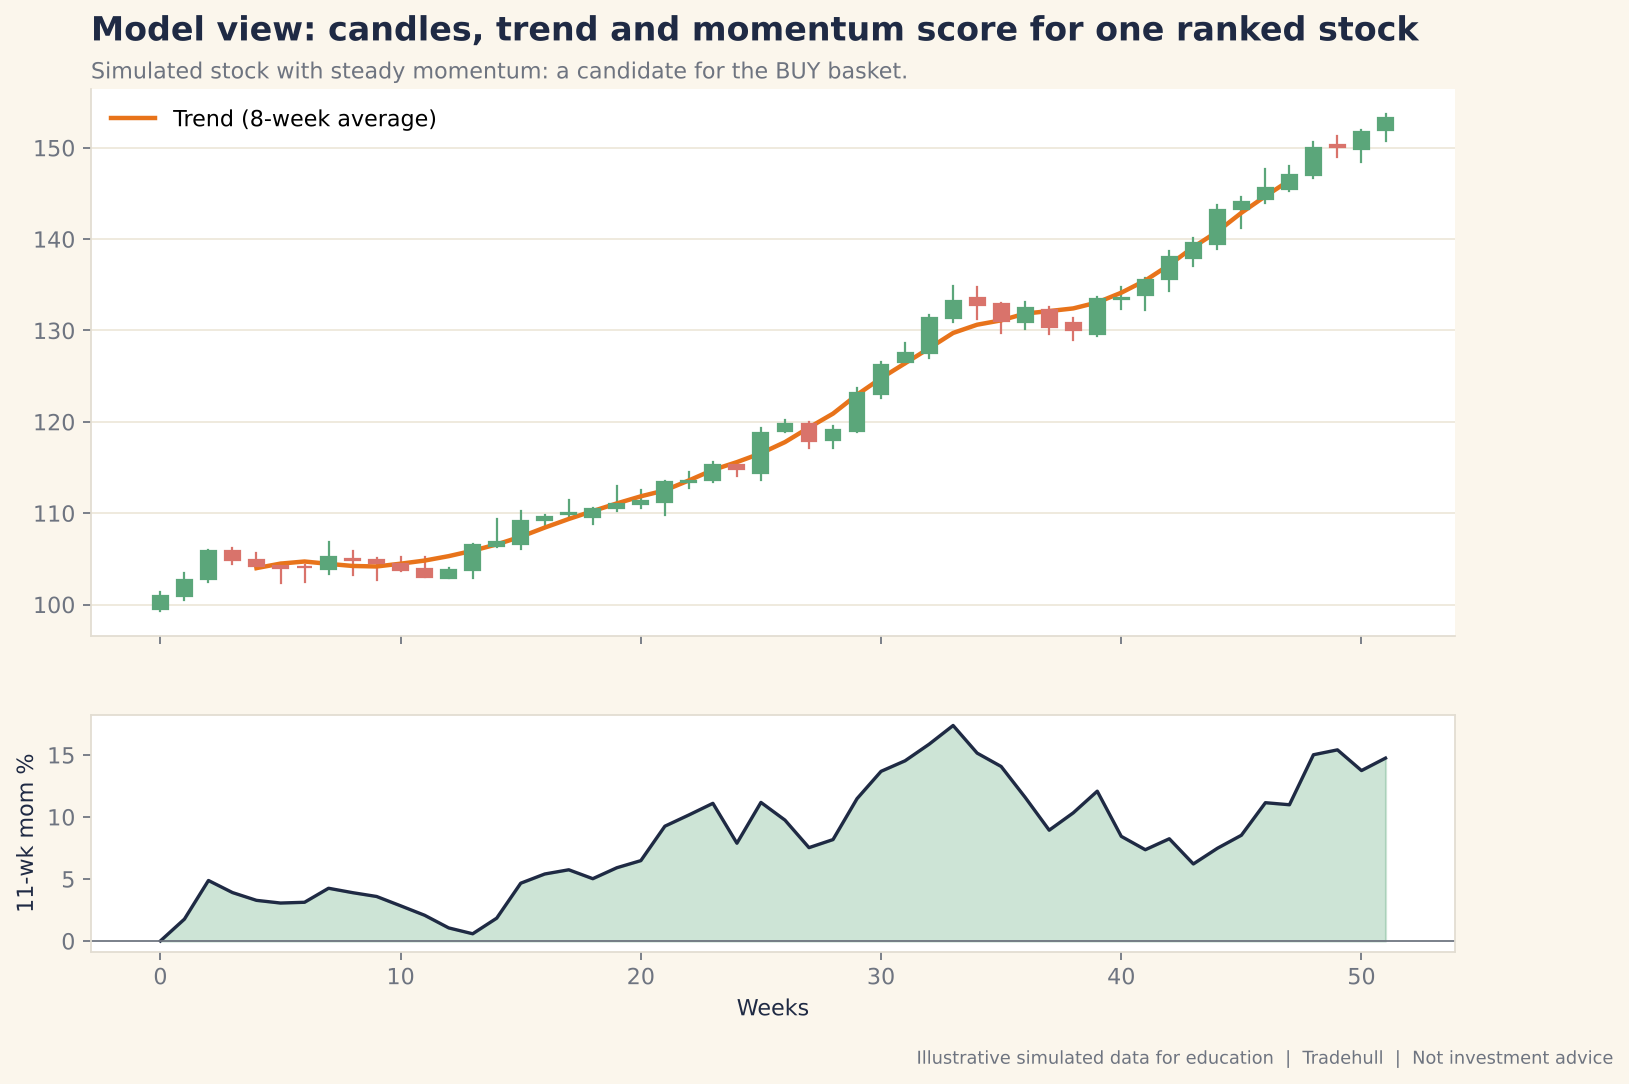
Illustrative model view: candles, a trend line and an 11-week momentum score for a stock in the BUY basket.
Timeframe: Swing First, Intraday to Test
This is built as a swing strategy with a monthly rebalance. You can also try the same structure intraday to test your ideas and create a baseline. The video suggests it will mostly not work intraday, but it is a good baseline to back-test.
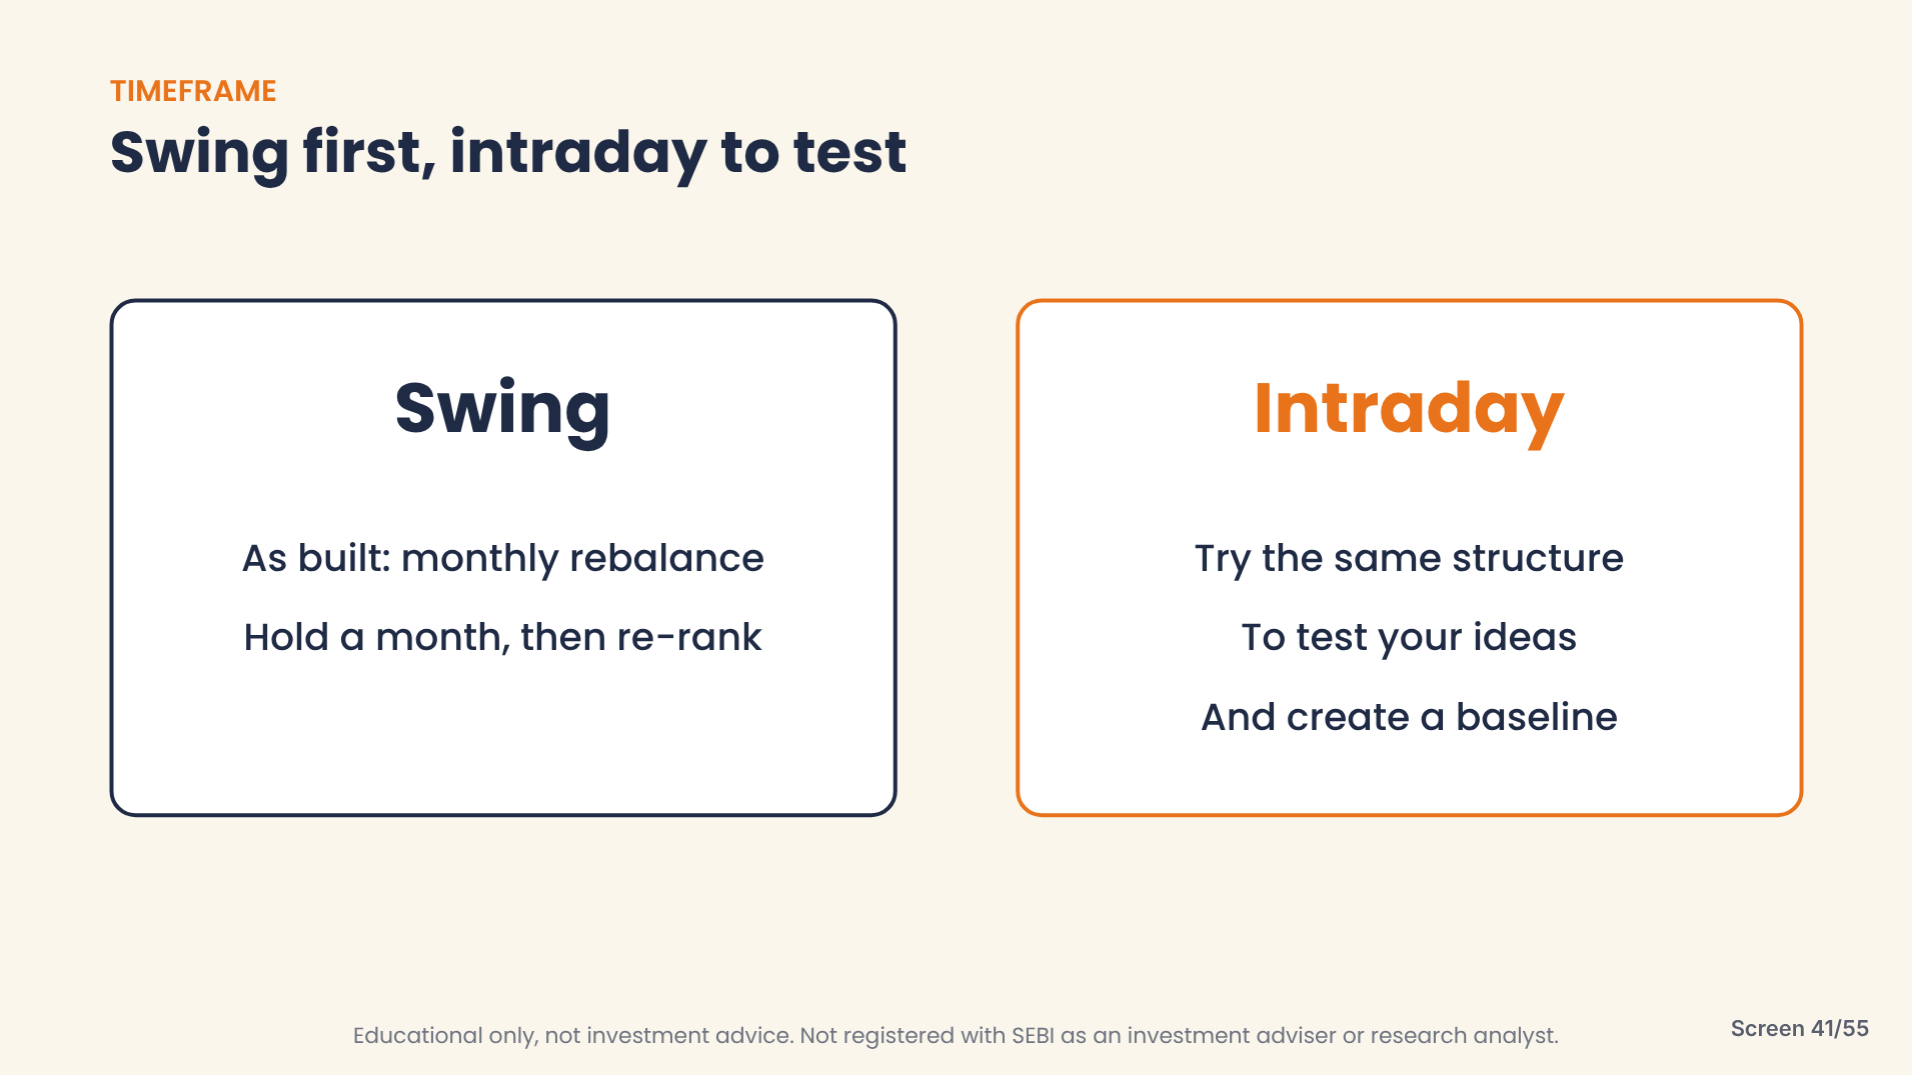
Slide: swing as built, intraday to test.
How a Fund Differs from a Retail Trader
| Typical retail trader | Cross-sectional momentum fund | |
|---|---|---|
| Unit of trading | One stock or option | A group of stocks |
| View | Bullish or bearish | Direction-neutral |
| Momentum | Takes any mover | Wants steady movers |
| Exit | Stop loss and target per trade | Monthly rebalance |
| Risk limit | Per trade | Per strategy |
| Trades | Many | Few |
The Final Strategy
- Take the F&O universe.
- Rank by the 12-month rise, skipping the latest month.
- Re-rank by steadiness.
- Buy the top 5 futures and sell the bottom 5 futures.
- Hold for a month.
- Rebalance.
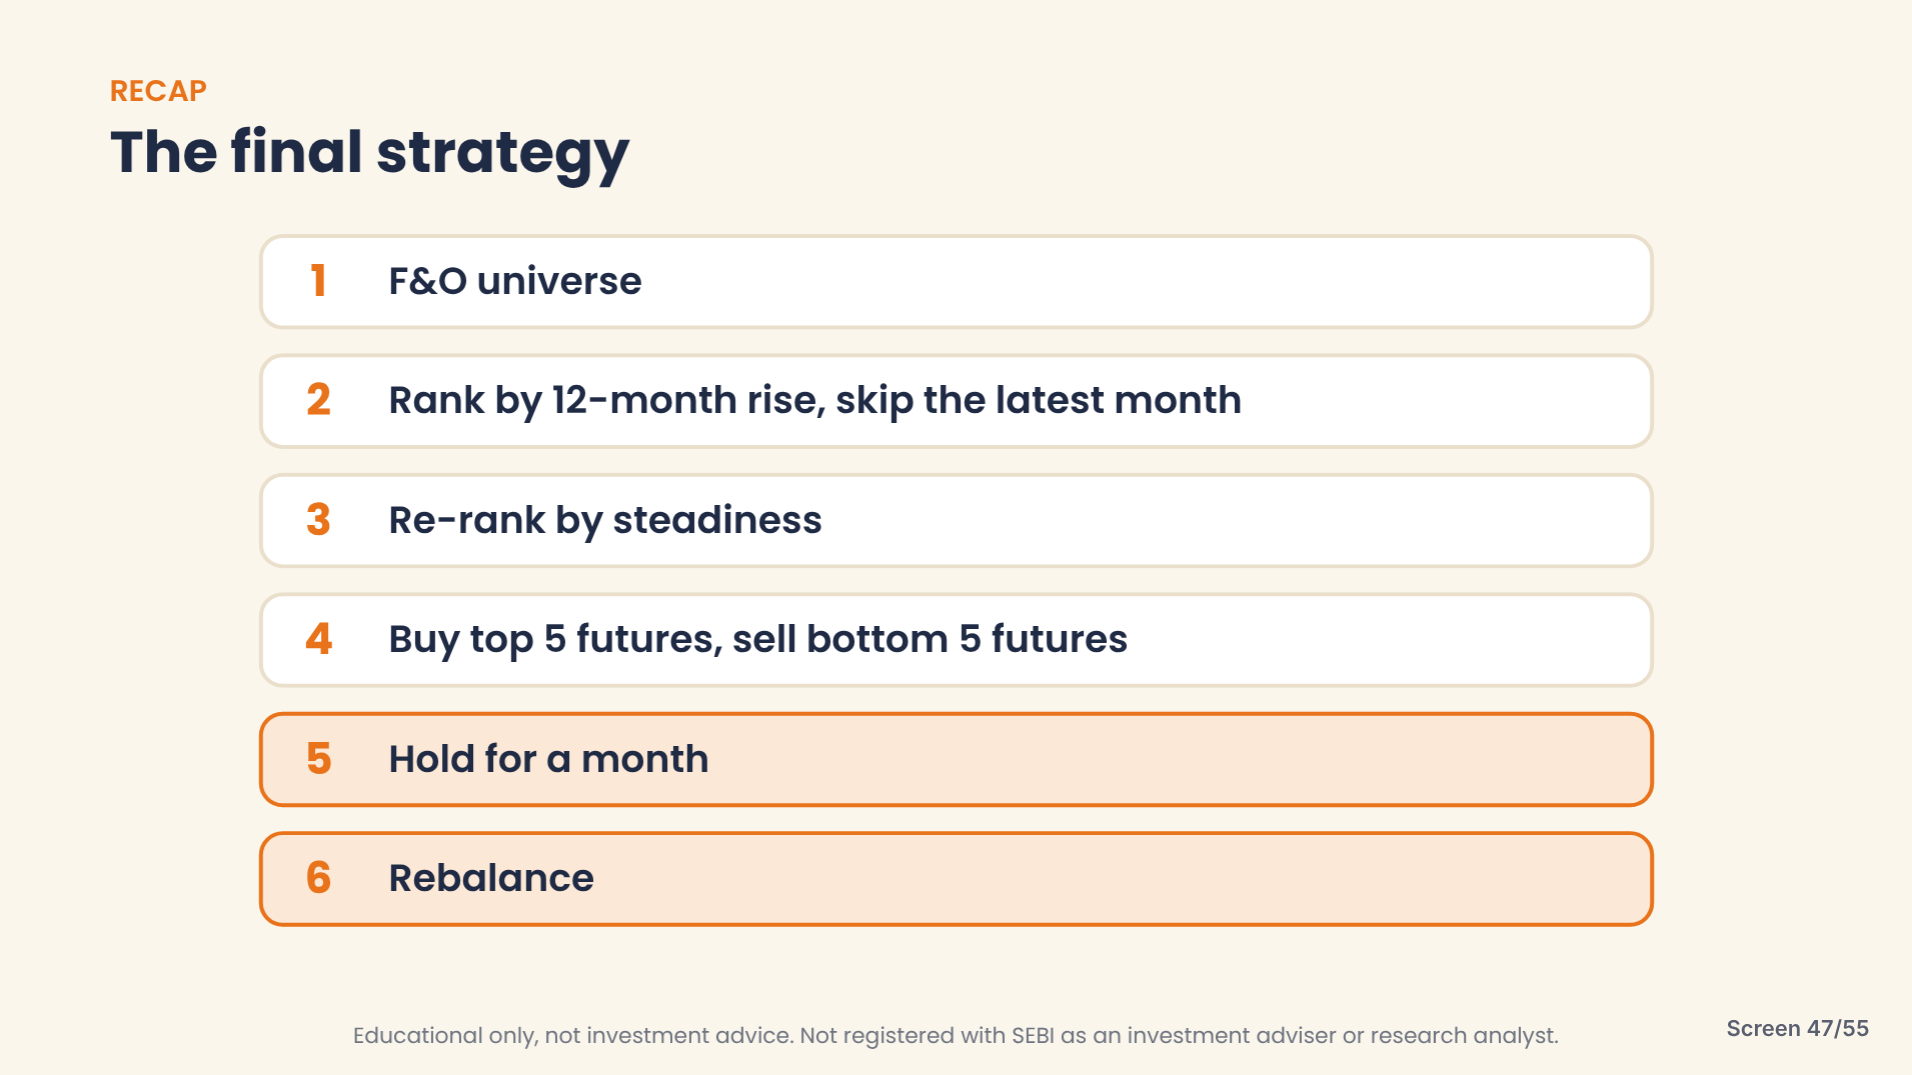
Slide: the full recipe.
Where It Comes From: Long-Standing Research
This is not a new idea. Cross-sectional momentum has been researched and traded for more than 30 years. The video shows how a strategy built on a basic principle can survive decades even when everyone knows it.
| Year | Type | Authors | Work |
|---|---|---|---|
| 1993 | Research paper | Jegadeesh & Titman | “Returns to Buying Winners and Selling Losers”, Journal of Finance, 48(1), 65-91 |
| 2013 | Research paper | Asness, Moskowitz & Pedersen | “Value and Momentum Everywhere”, Journal of Finance, 68(3), 929-985 |
| 2016 | Book | Wesley Gray & Jack Vogel | Quantitative Momentum, Wiley |
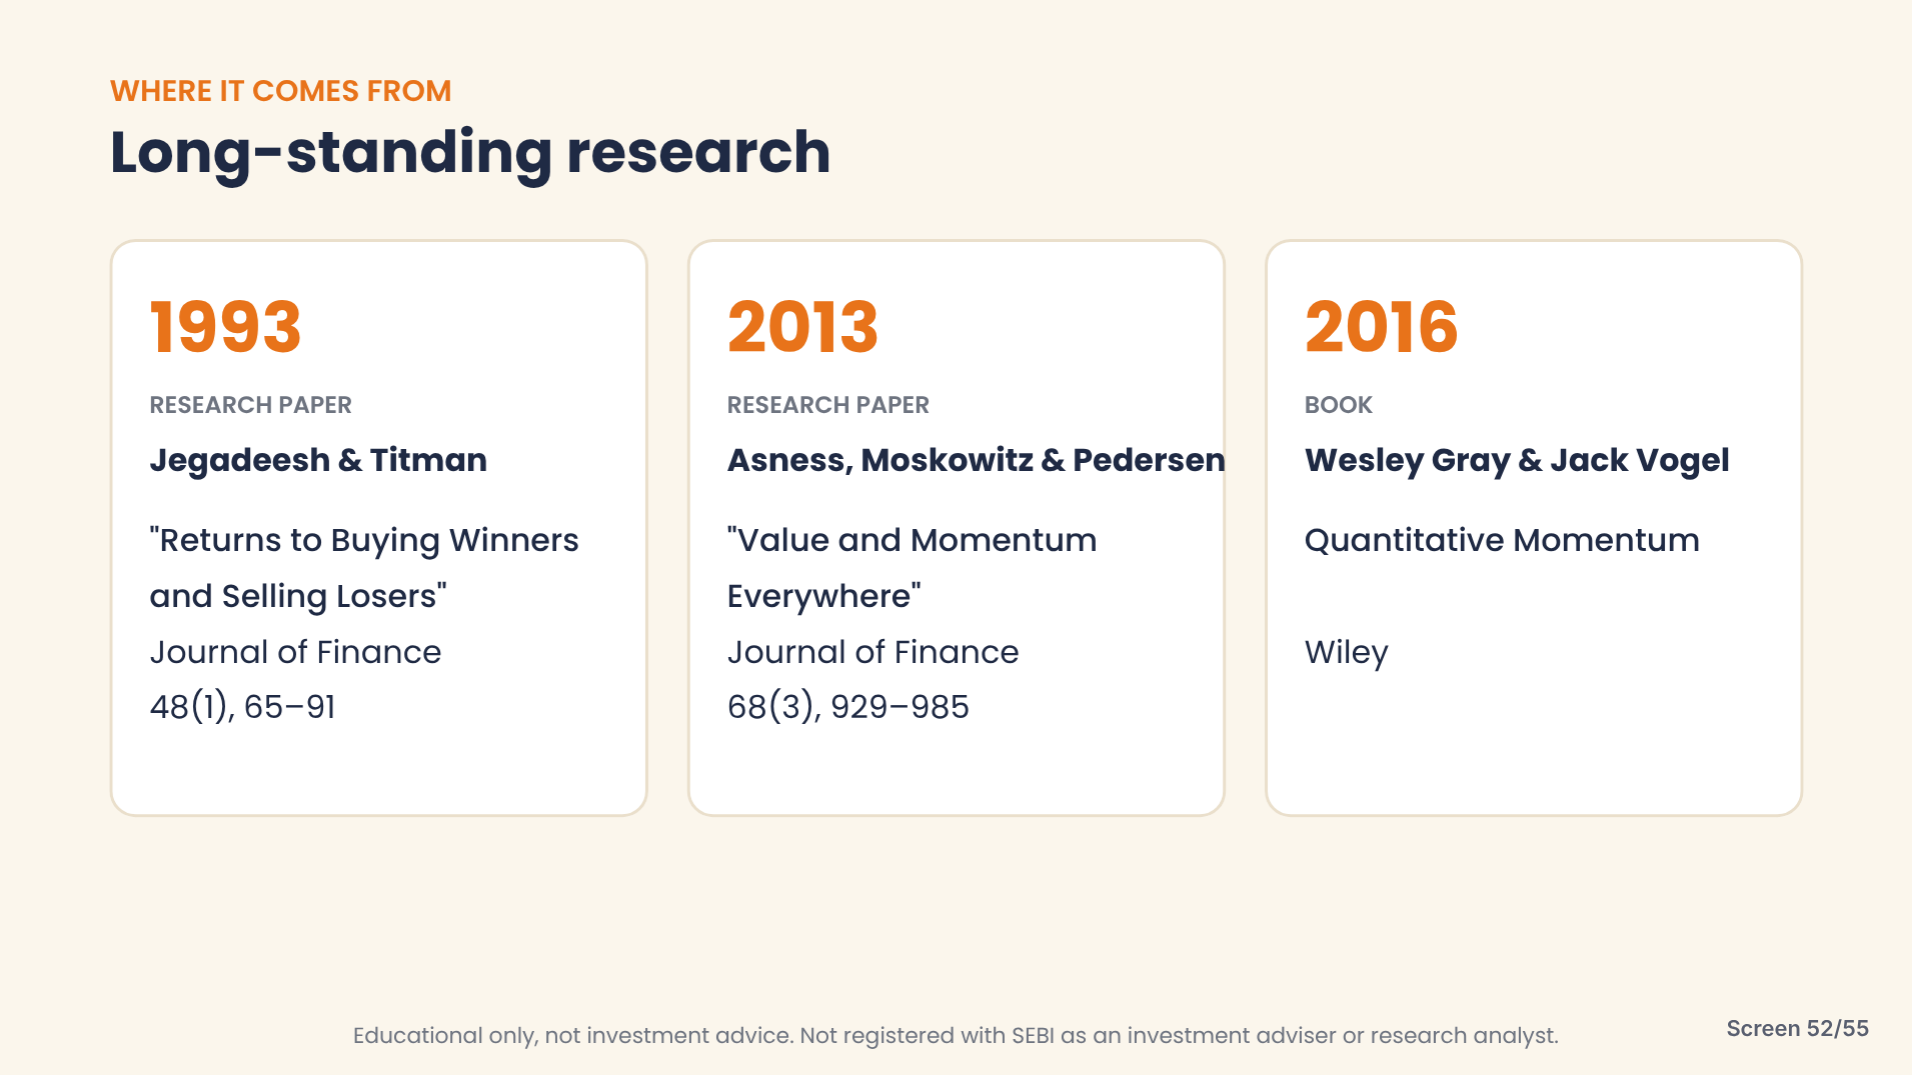
Slide: the research behind the strategy.
Summary
- Pick a universe of about 200 stocks, such as Nifty F&O.
- Rank by 12-month rise, skipping the latest month.
- Re-rank for steadiness so you prefer calm movers over jumpy ones.
- Buy the top 5 and sell the bottom 5 in futures. You trade the spread, not direction.
- Rebalance monthly. Strategy-level risk limits replace trade-level stops.
- Study how funds work, then adapt the same ideas to the way you trade.