Hi @Everyone,
How the Binary Segmentation indicator finds trend changes and helps you ride the biggest part of a move
Resources
- YouTube Video: https://youtu.be/IVnkIzPCAaQ?si=YuB4lRpI_3Yh99mm
- Drive link, Prompt, Scripts: https://drive.google.com/drive/folders/1Q2TzYaMeJEvotJLjcm6HR6s6q7VFkK6Q?usp=drive_link
Why Trend Catching Matters
Whatever you trade, one question decides the quality of your results: how much of the trend are you actually able to catch?
Suppose the market delivers a 100-point trend. If your method captures only 30 of those points, it is a weak trend-catching algorithm. If it captures 65 points of the same move, it is a clearly better one. The market did the same thing in both cases; only the way the trend was caught differed.
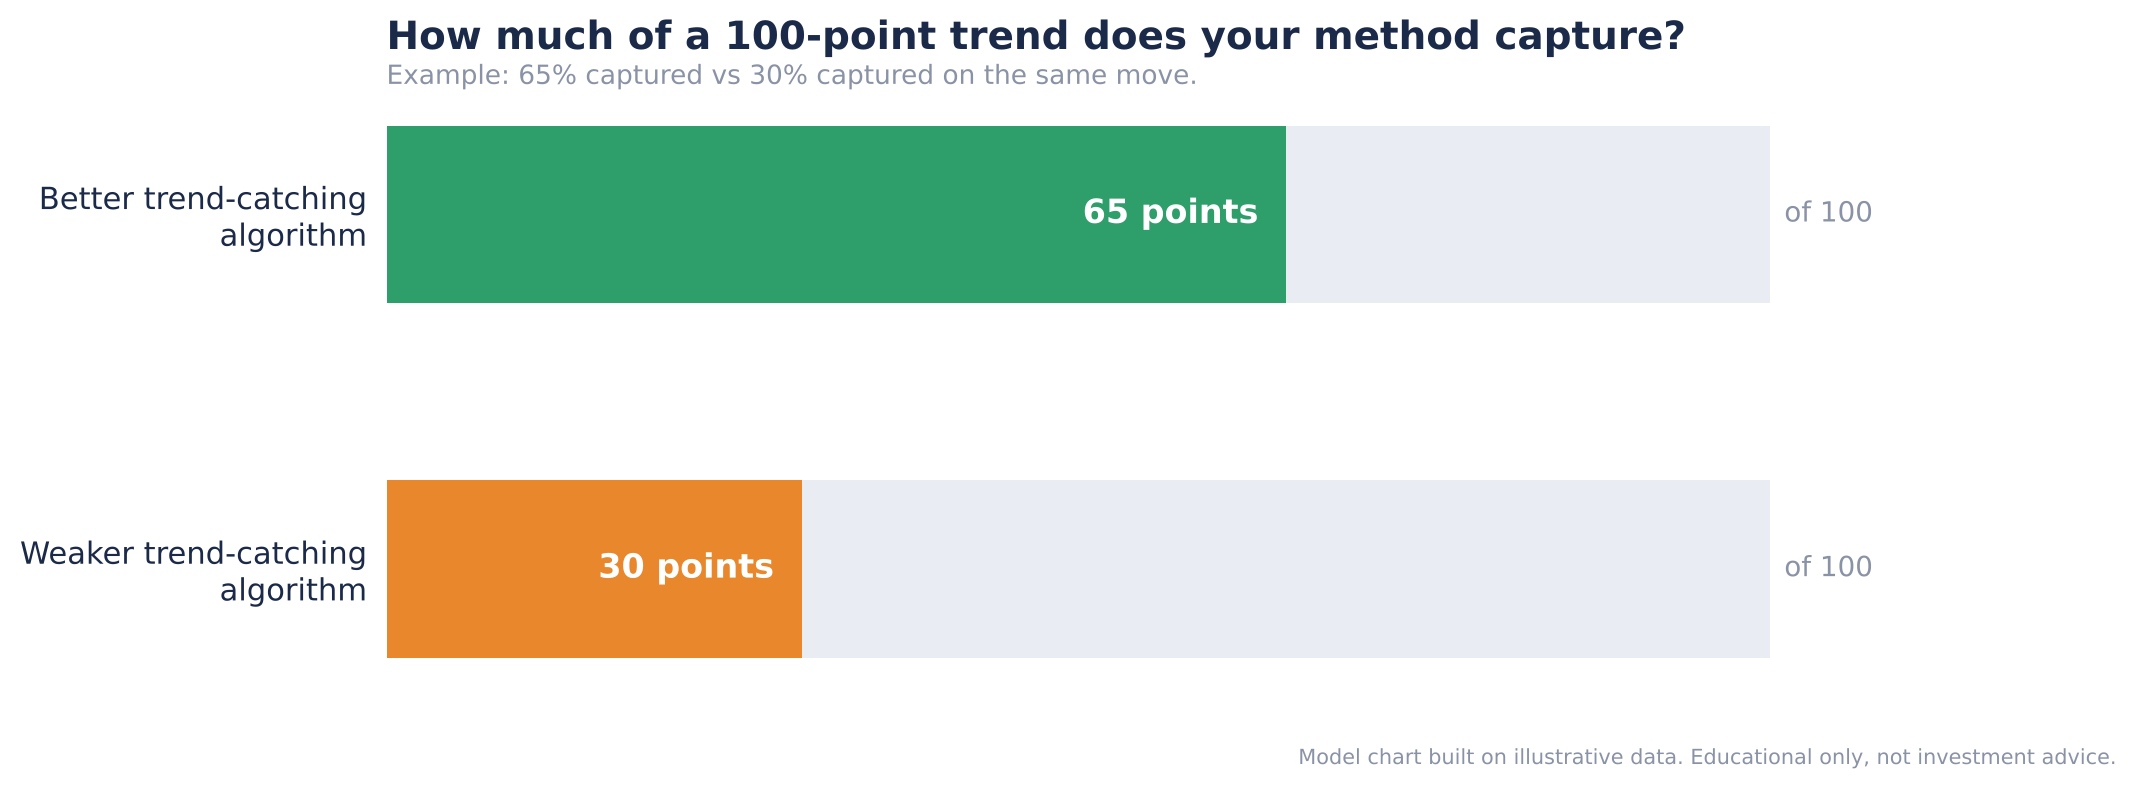
Figure 1: The same 100-point trend, captured at 65% by a better algorithm and at 30% by a weaker one
Trend catching is not limited to one style of trading. It sits underneath almost every approach:
| Trading style | Why you need to catch the trend |
|---|---|
| Trend following | The whole strategy is built on staying with a move for as long as it lasts. |
| Momentum trading | You must identify the direction a stock is moving in before you can ride it. |
| Breakout trading | Breakouts create very short-term trends that have to be caught quickly. |
| Option selling | You must catch the trend of theta decay, the steady fall in option premium. |
Until now, most traders have caught trends with whatever was readily available, usually a moving average or Supertrend. That is a sensible place to start, but it limits you to the ideas other people have already packaged. Dhan Charts changes this: it lets you build your own indicators and plot even complex ones directly on the chart. The indicator in this guide, Binary Segmentation, is the first version of a Trend Catching Algorithm (TCA) built that way.
Note: This guide opens up the internal logic of an indicator. Most traders use Supertrend, RSI or Donchian Channels without ever seeing the formula behind them. Understanding how TCA works internally lets you use it with far more confidence.
What Is the Binary Segmentation Indicator?
Binary Segmentation is a trend-catching indicator. Its goal is simple: help you catch the biggest part of a trend. Given a price chart, it asks where a trend really began and where it really ended, so that you can stay with as much of the move between those two points as possible.
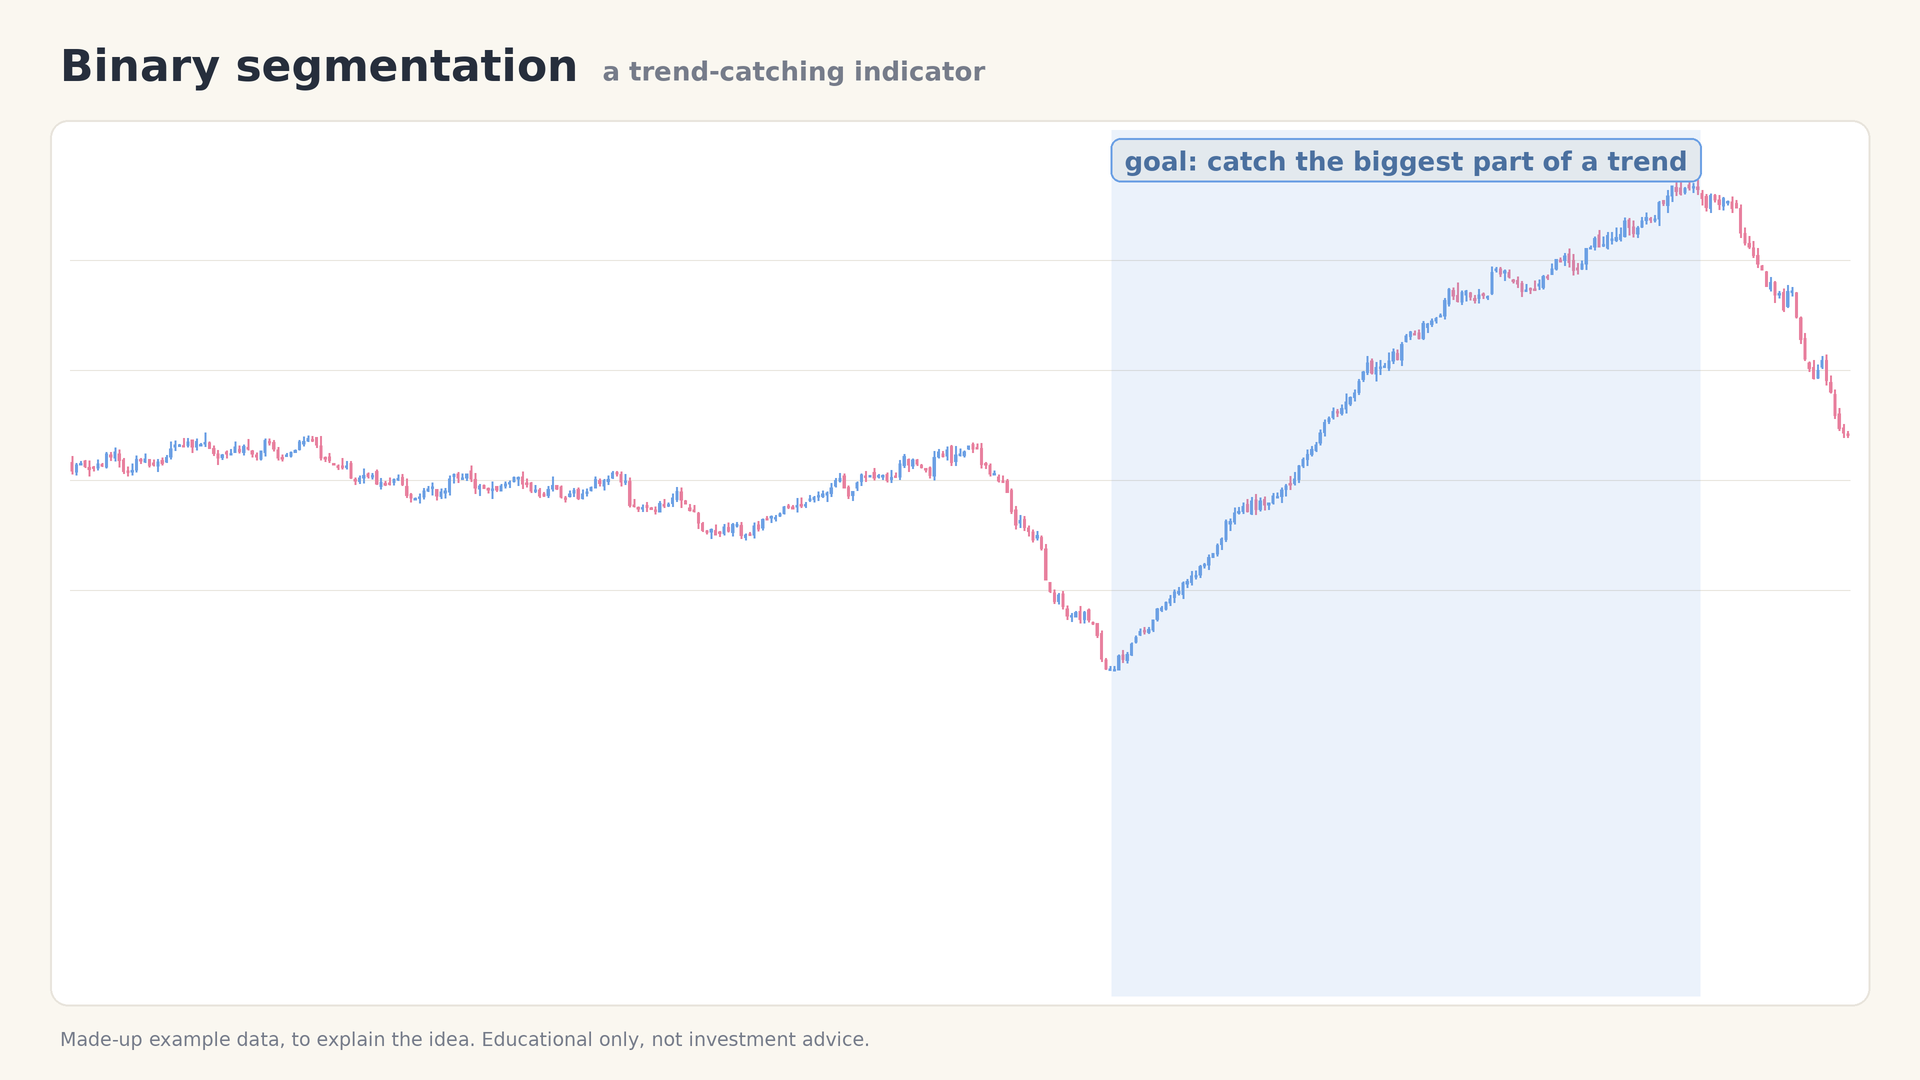
Figure 2: The goal: catch the biggest part of the trend, from its real start to its real end
The indicator is built from two ingredients:
- The binary segmentation formula, which finds the points where the behaviour of price genuinely changes.
- ATR (Average True Range), which is used to follow the trend at a sensible distance once a change has been found.
The workflow has three steps. They are repeated on every new candle, and the sections that follow explain each one in turn.
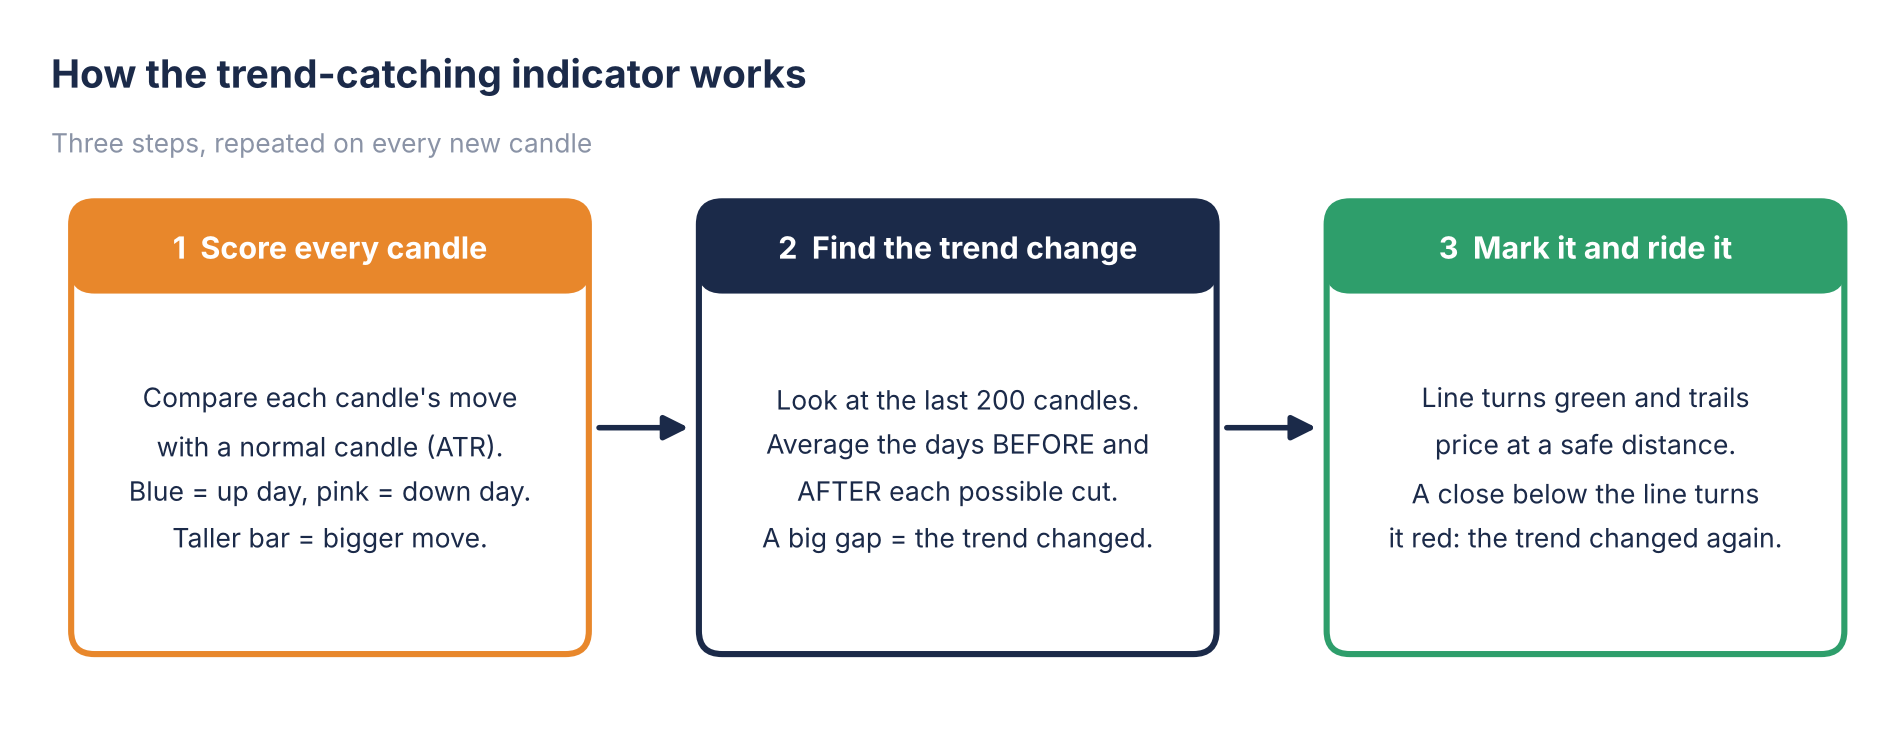
Figure 3: The three-step workflow of the Binary Segmentation indicator
Step 1: Score Every Candle
What to do: Measure how big each candle is compared with a normal candle, and give every candle a score.
Why: Before the indicator can judge whether the trend has changed, it needs a consistent measure of how strongly price is moving. Raw price alone cannot tell it that.
How it works: For each candle, the indicator asks: how much did this candle move compared with a normal candle? The answer is the candle’s score. Most candles are small. Some are big red candles and some are big green candles. The scores are drawn as bars in a panel under the price chart:
- A blue bar is an up candle and a pink bar is a down candle.
- The taller the bar, the bigger the move.
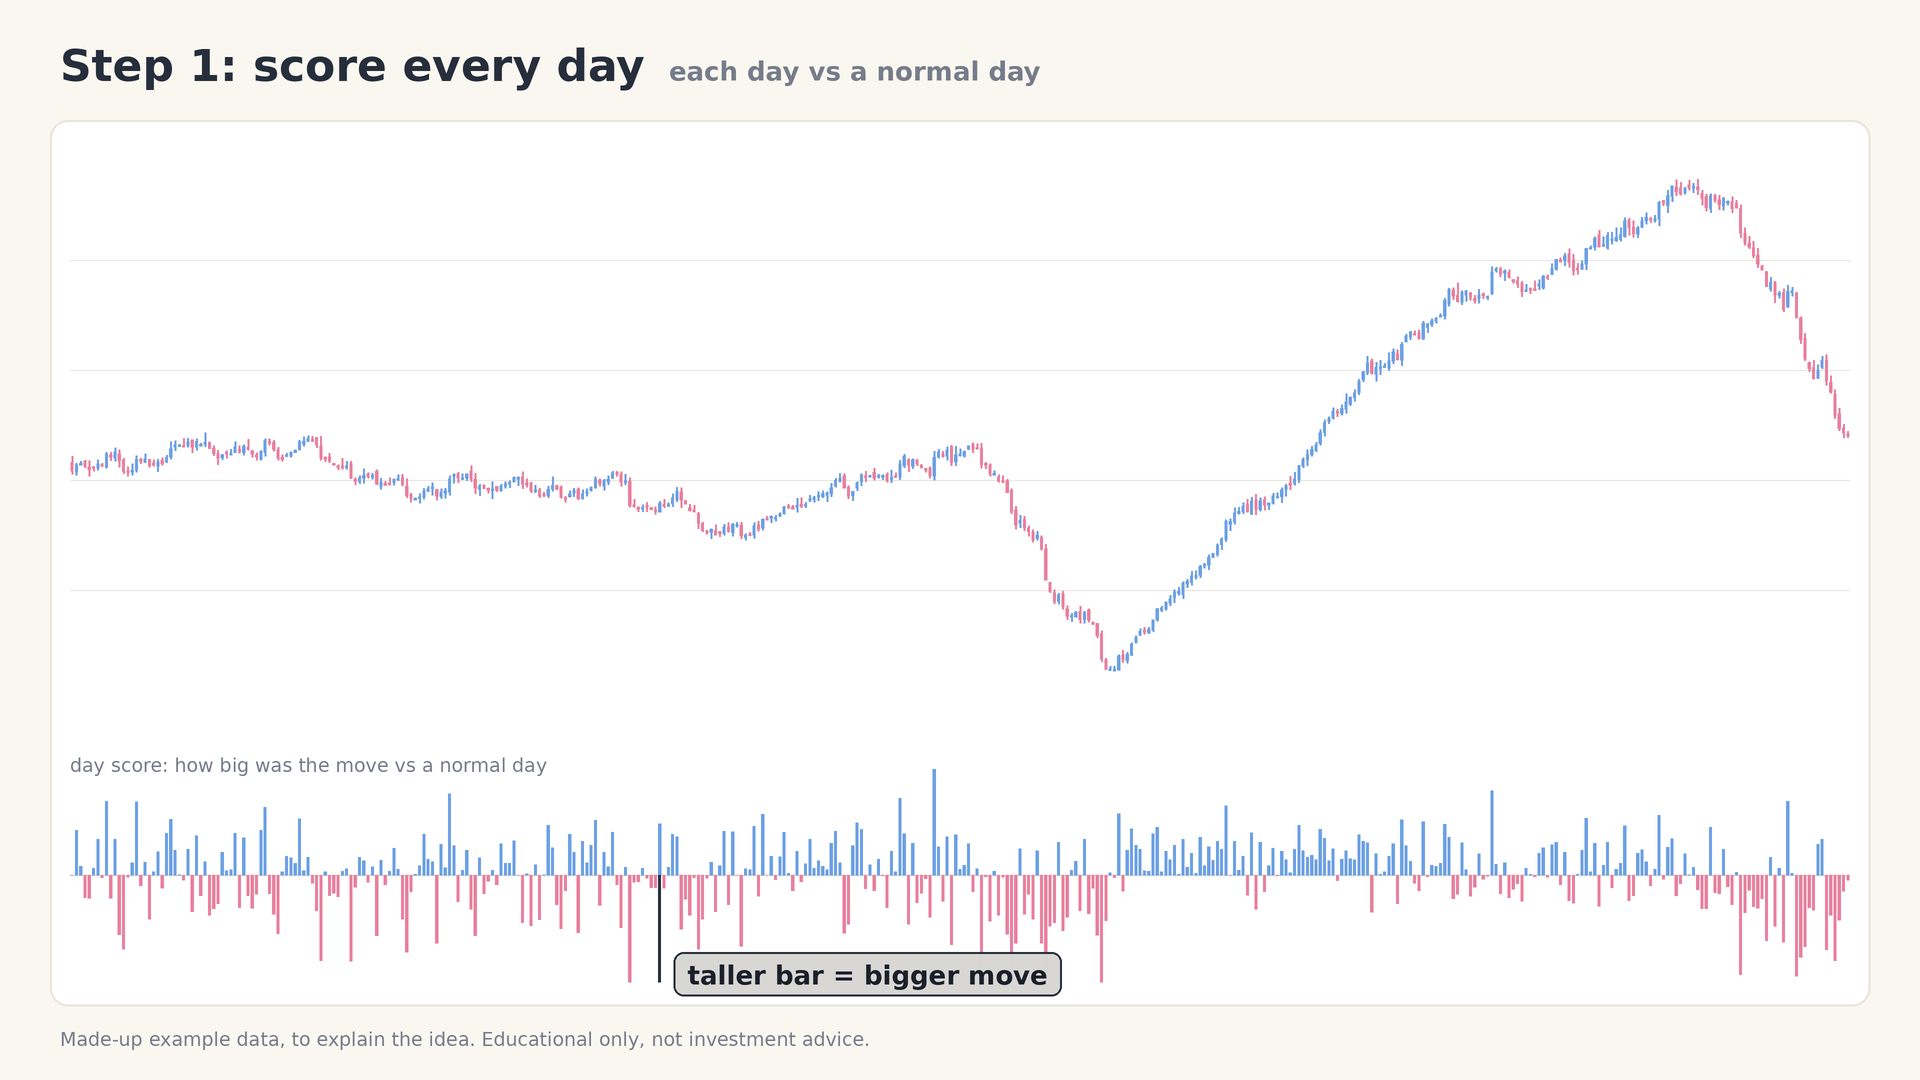
Figure 4: Every candle is converted into a bar: blue for up moves, pink for down moves, taller for bigger moves
The chart below shows the same idea on a model candlestick chart. The quiet, sideways candles on the left produce short bars, while the large red candle during the decline and the large green candle during the advance produce the tallest bars.
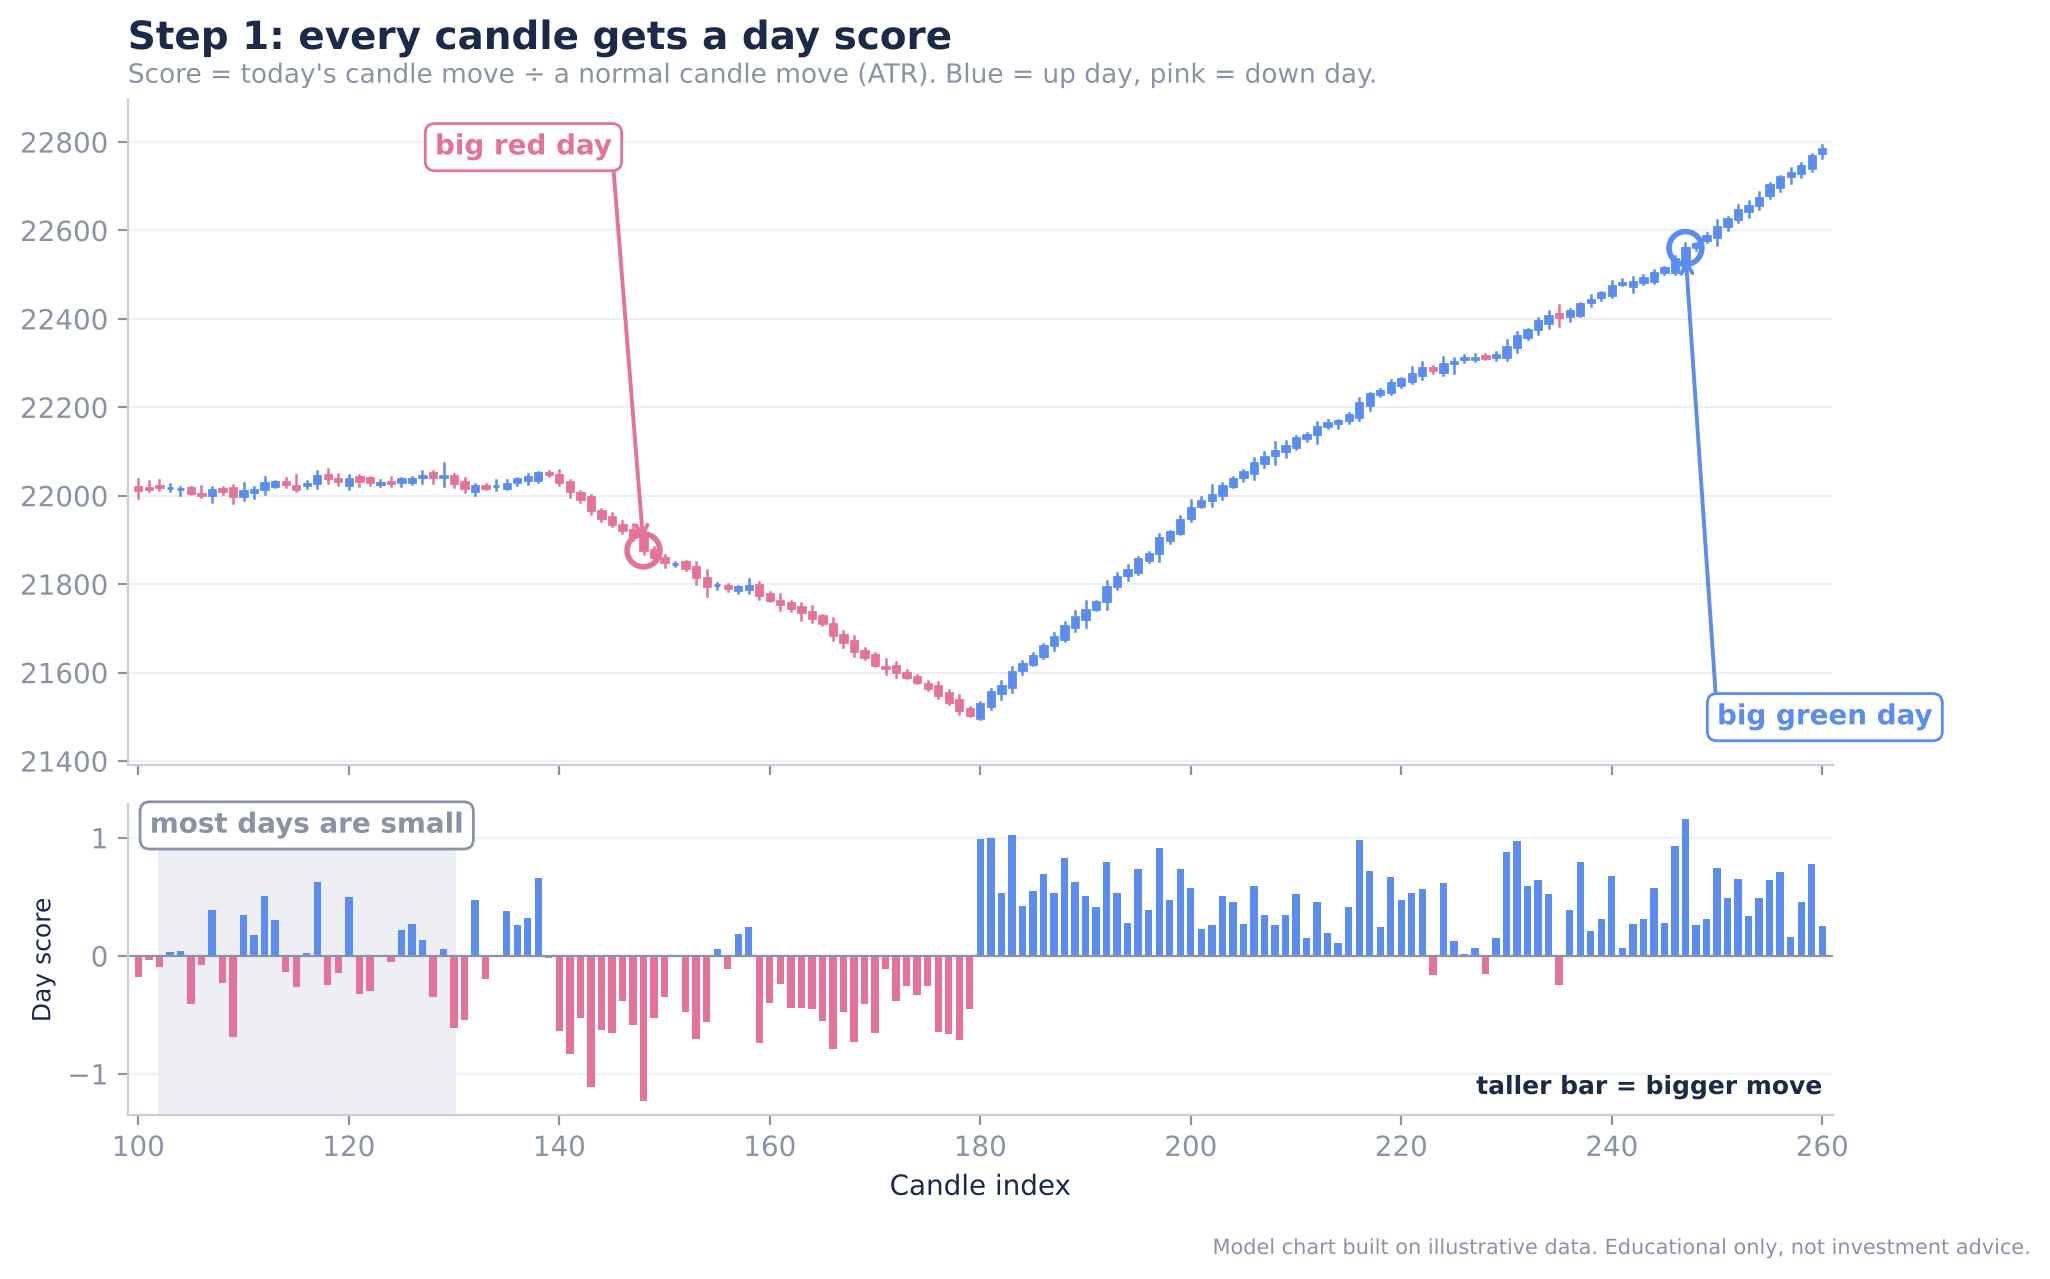
Figure 5: Model candle chart with its day-score panel: big red and big green candles stand out as tall bars
Expected result: Every candle now has a score, and the sequence of scores is the raw material for Step 2.
Tip: The word “day” is used loosely. The same scoring works on any timeframe: a candle can be a minute, an hour or a day.
Step 2: Find Where the Trend Really Changed
What to do: Search the recent candles for the point at which the behaviour of price changed the most.
Why: A price chart is rarely one clean move. Look at the example below: price moves sideways, turns down, rallies strongly, and finally falls again. That is four different phases. If we can identify exactly where each one began, we can build much better strategies around them.
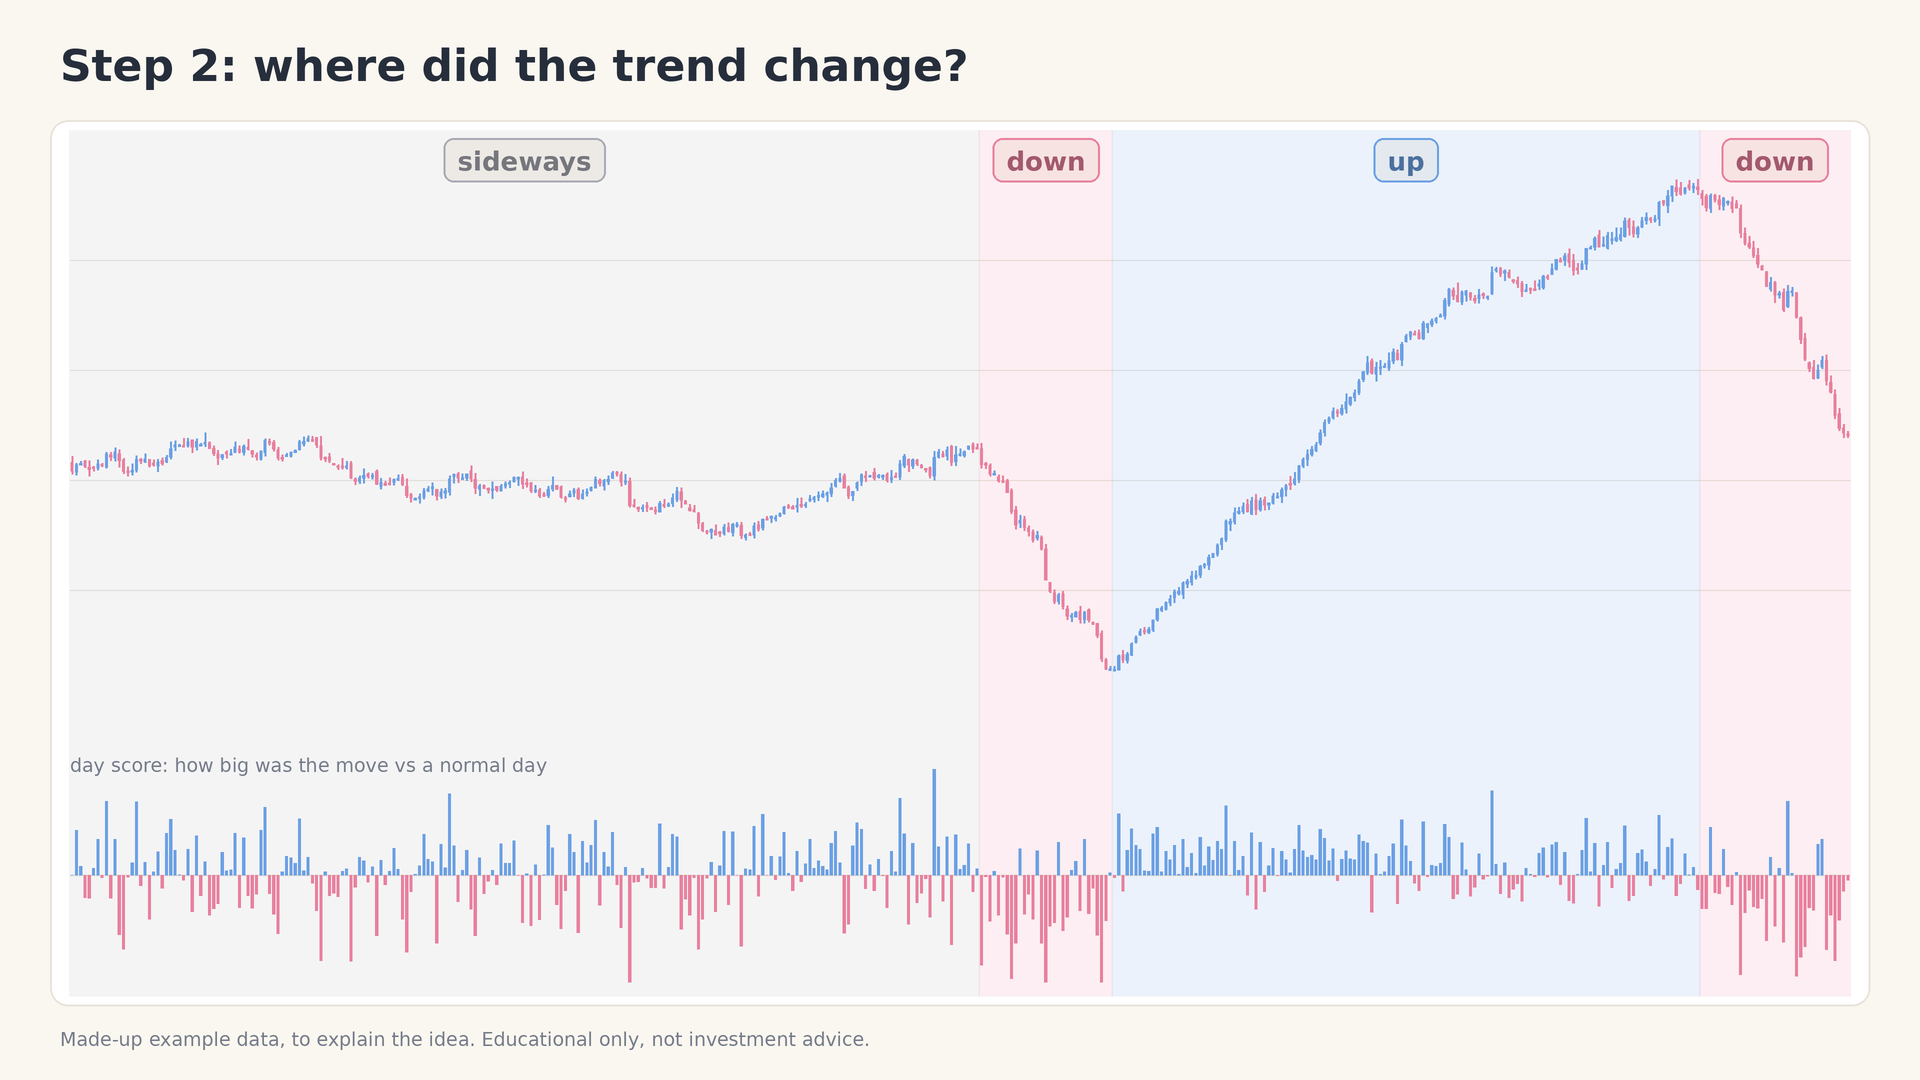
Figure 6: One price chart, four phases: sideways, down, up, and down again
How it works: The indicator reads the last 200 candles. Inside that window it tries every possible cut point and, for each one, takes two averages of the candle scores: the average of the candles before the cut and the average of the candles after the cut.
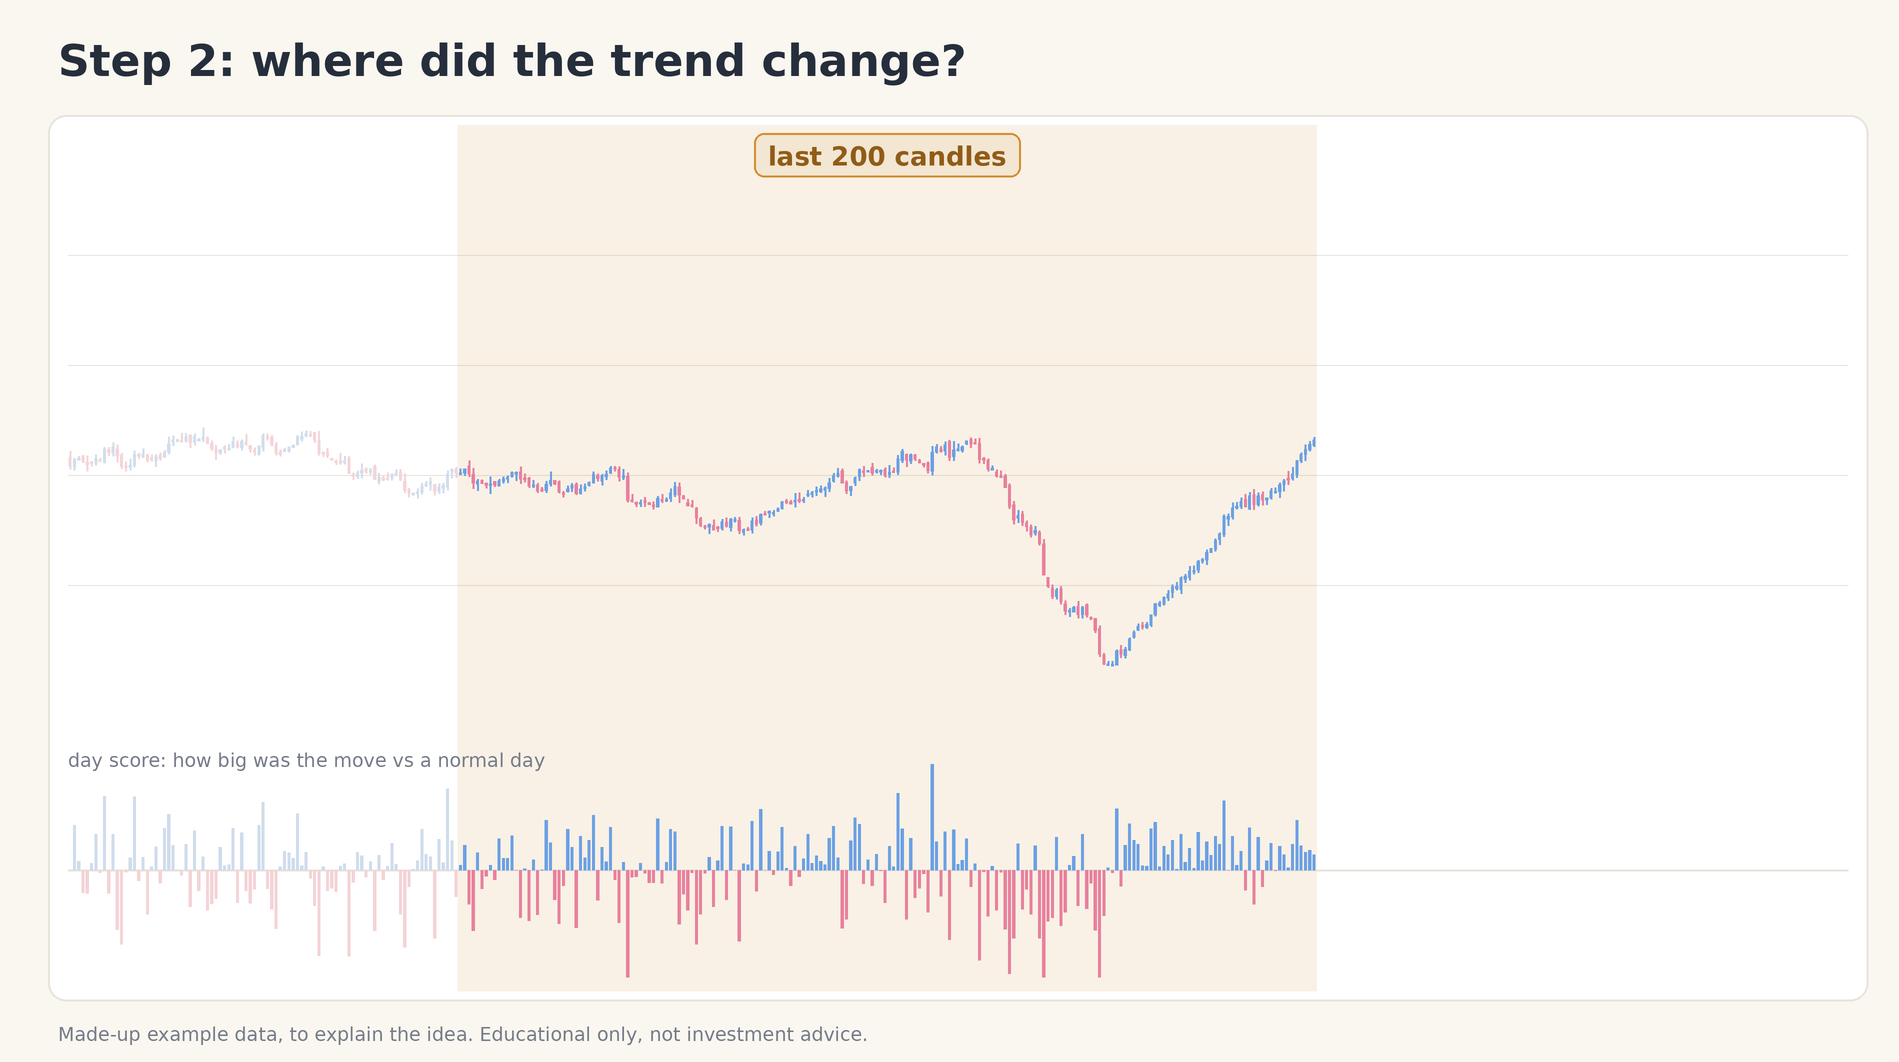
Figure 7: The indicator works on a window of the last 200 candles
Then it compares the two averages. There are two possible outcomes.
When the gap is small, nothing has changed
If the candles before and after a point behave almost the same way, the two averages are close together. This is not a position where a trend has changed, so the indicator does nothing.
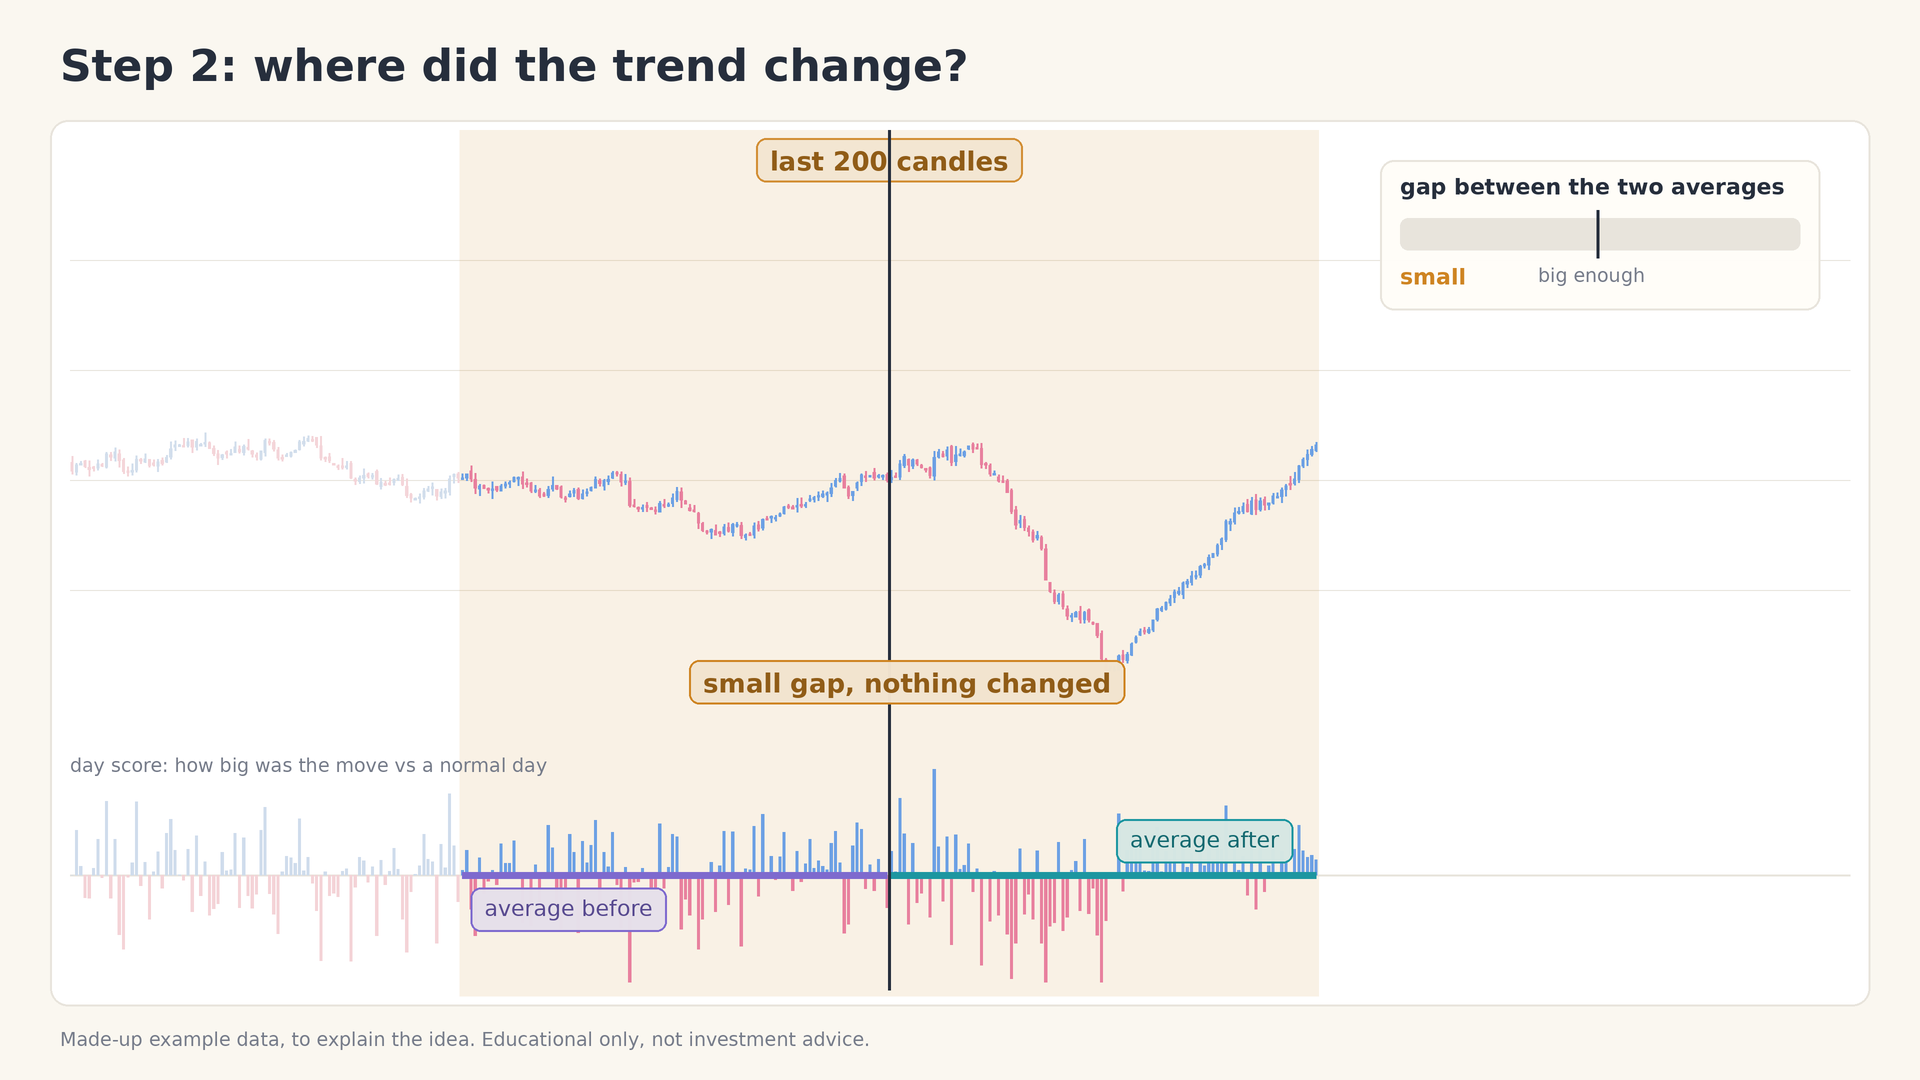
Figure 8: A small gap between the two averages means no real change
When the gap is big, the trend has changed
If the candles before the point and the candles after it behave completely differently, for example sideways and falling before, rising after, the two averages are far apart. That is the point where the indicator makes its cut and marks that the trend changed here.
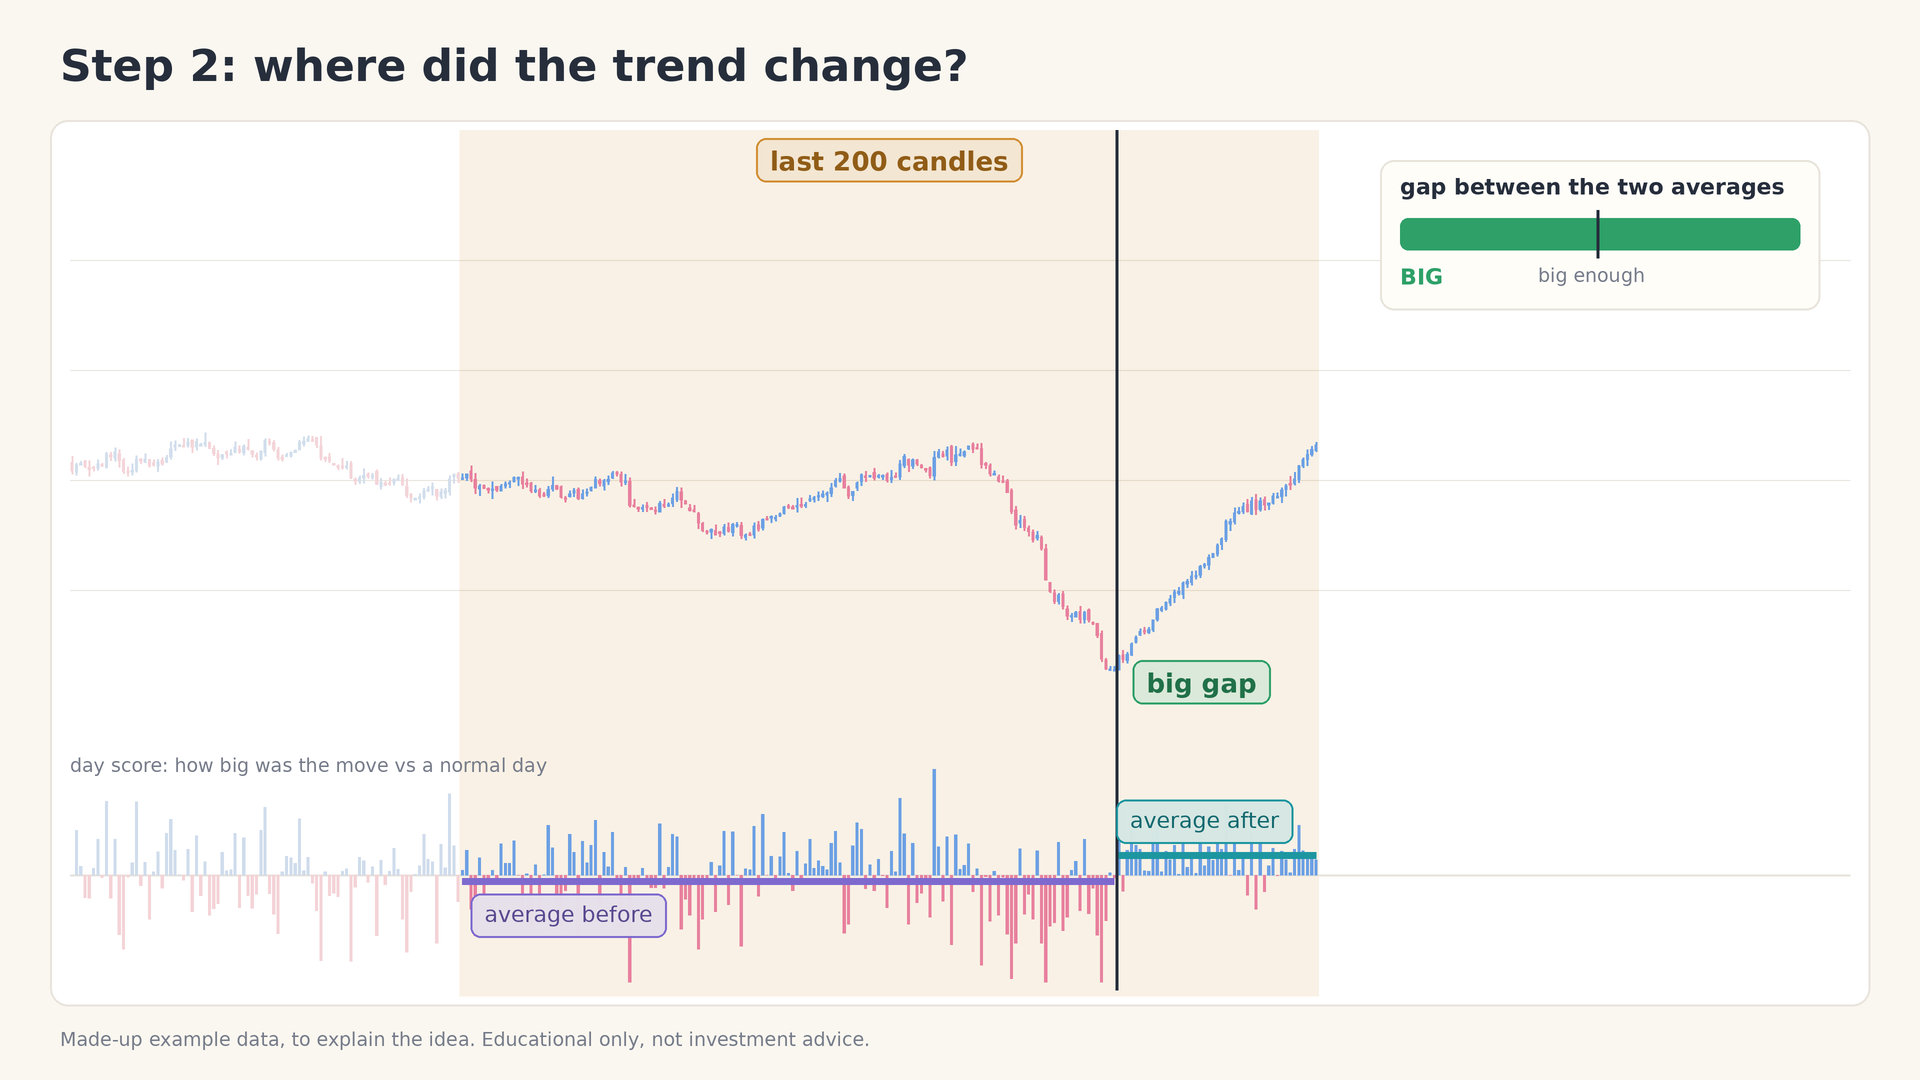
Figure 9: A big gap between the two averages
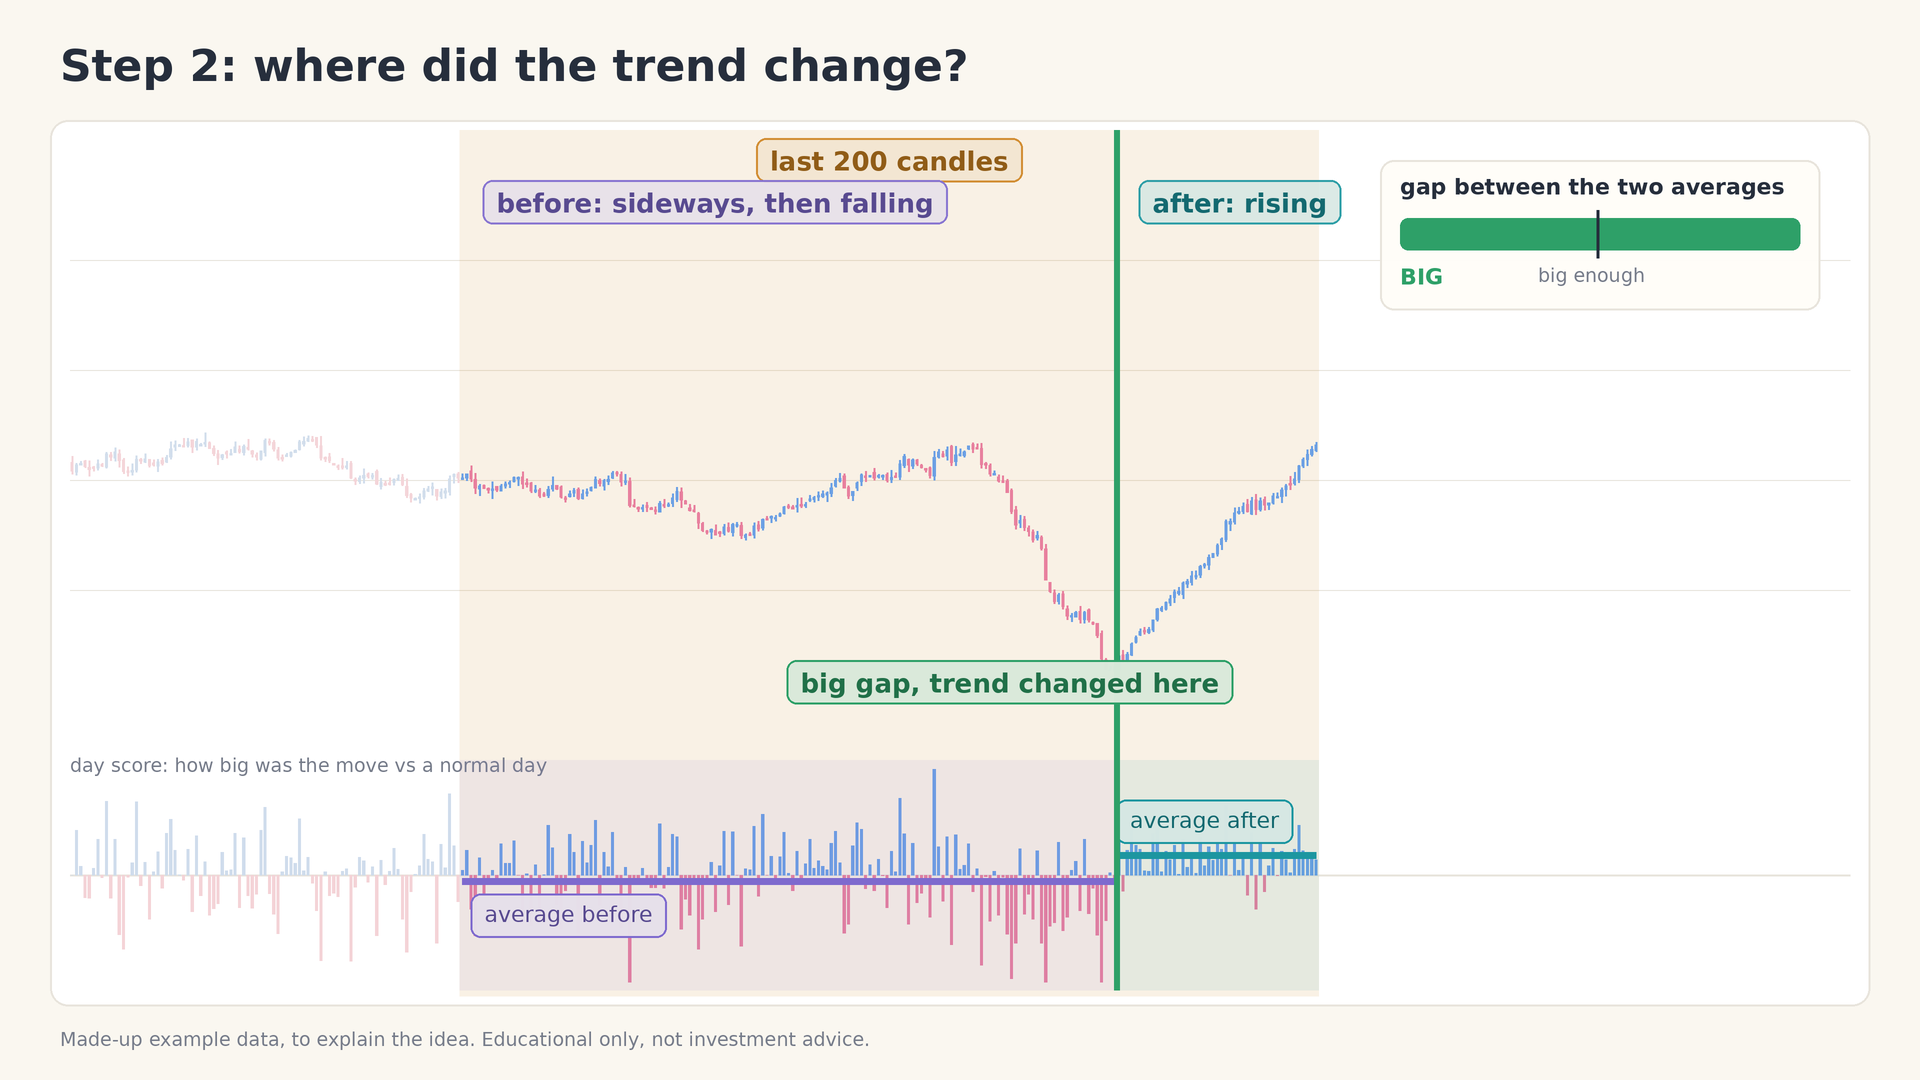
Figure 10: The cut: the candles before (sideways, then falling) and after (rising) behave completely differently
| Small gap | Big gap | |
|---|---|---|
| Average before vs average after | Close together | Far apart |
| Behaviour of price | Similar before and after | Completely different before and after |
| What the indicator concludes | Nothing has really changed | The trend changed at this point |
| Action | No mark is drawn | A cut is made and the change is marked |
The model chart below shows both cases on one price series. On the left, a cut in the sideways part of the chart produces an almost zero gap. On the right, a cut at the market low produces a large gap, because the candles before it were mostly falling and the candles after it are rising.
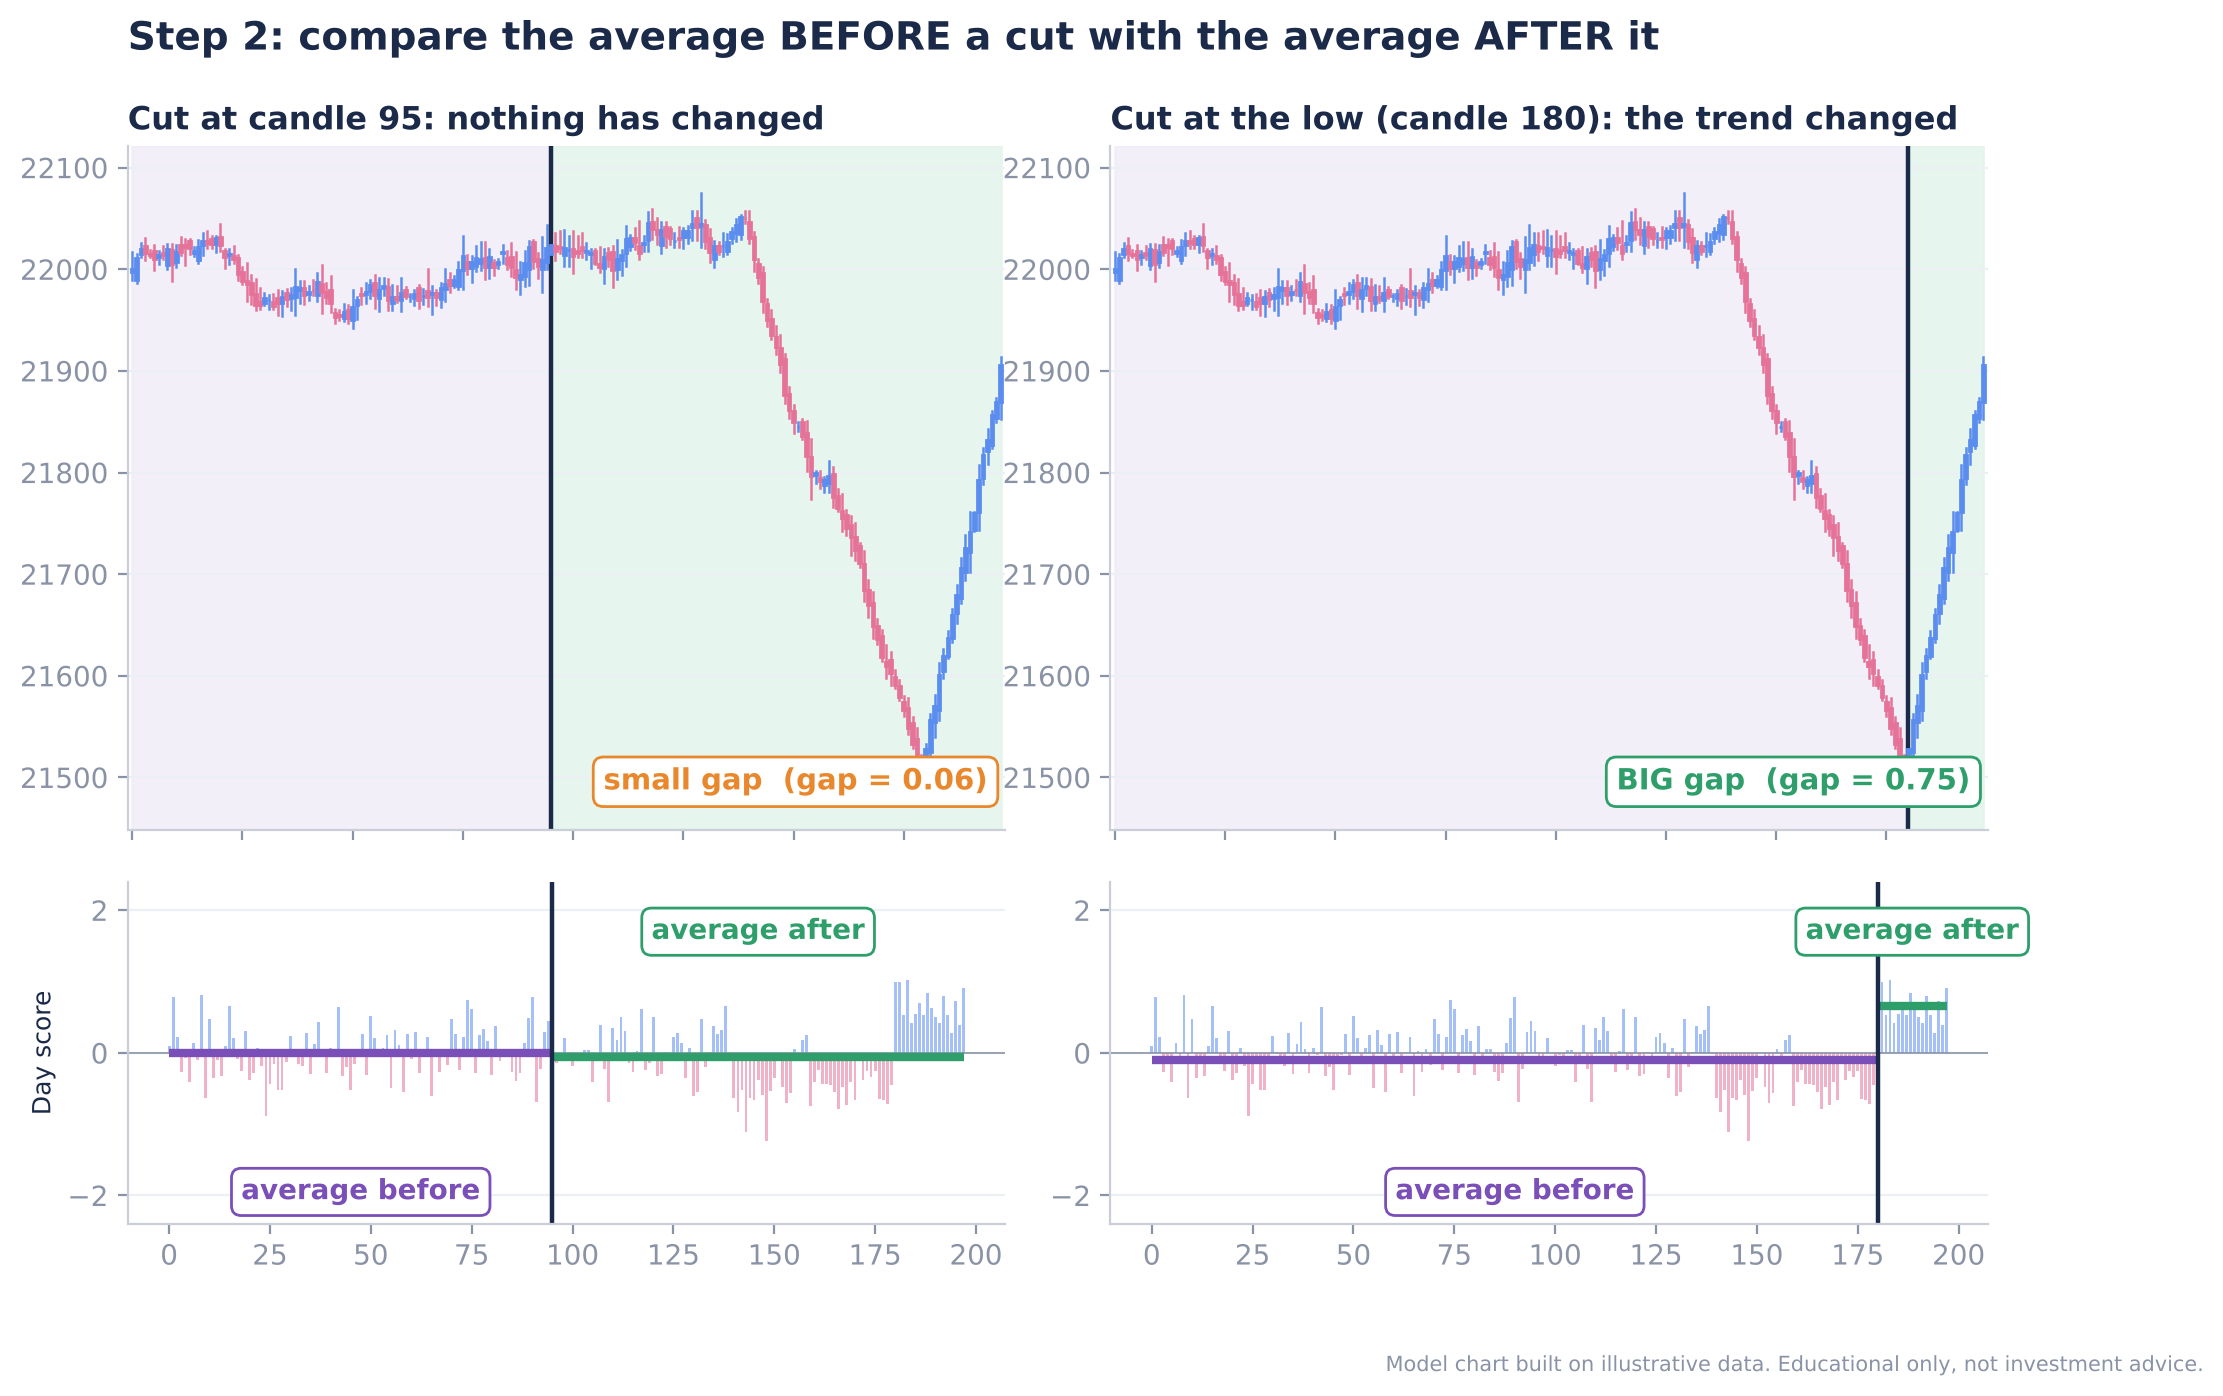
Figure 11: Model chart: a cut with a small gap (left) and a cut at the low with a big gap (right)
The lower panel on Dhan Charts
On a live Dhan chart you can read this comparison directly. In the lower panel the indicator draws two lines, one violet and one green. While they sit at about the same level, nothing has changed. When a clear gap opens between them, the indicator reports that the trend has changed and starts marking from that point.
Real-time behaviour: confirmation comes a few candles late
There is one important detail. The exact cut point can only be seen looking back. In real time, the average “after” the cut uses only the candles from the cut up to today. Nothing to the right of today exists yet.
Take the example below. A few candles after the turn, the gap is still small, so it is too early to tell.
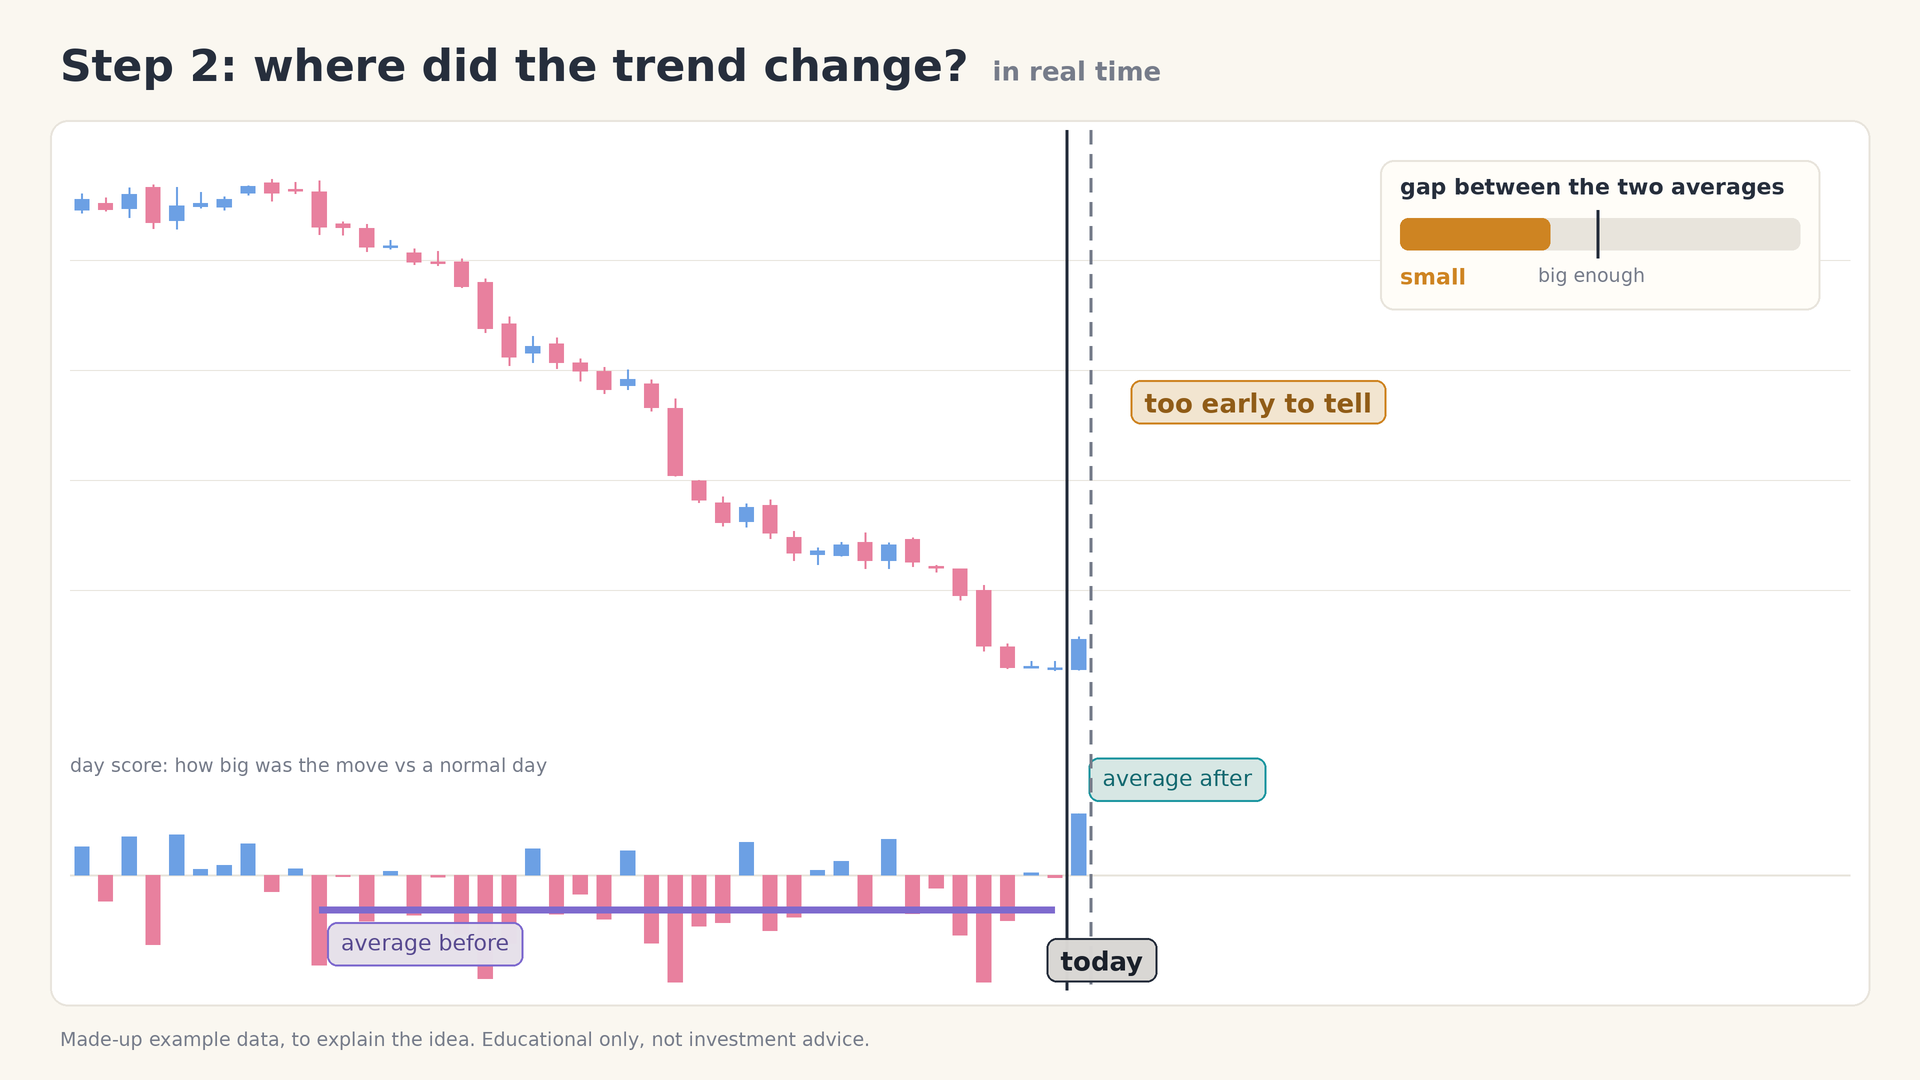
Figure 12: Real time, a few candles after the turn: the gap is still small, so it is too early to tell
A few candles later, enough new candles have piled up and the gap is big. The change is now confirmed, a few candles after the bottom, and the line turns green.
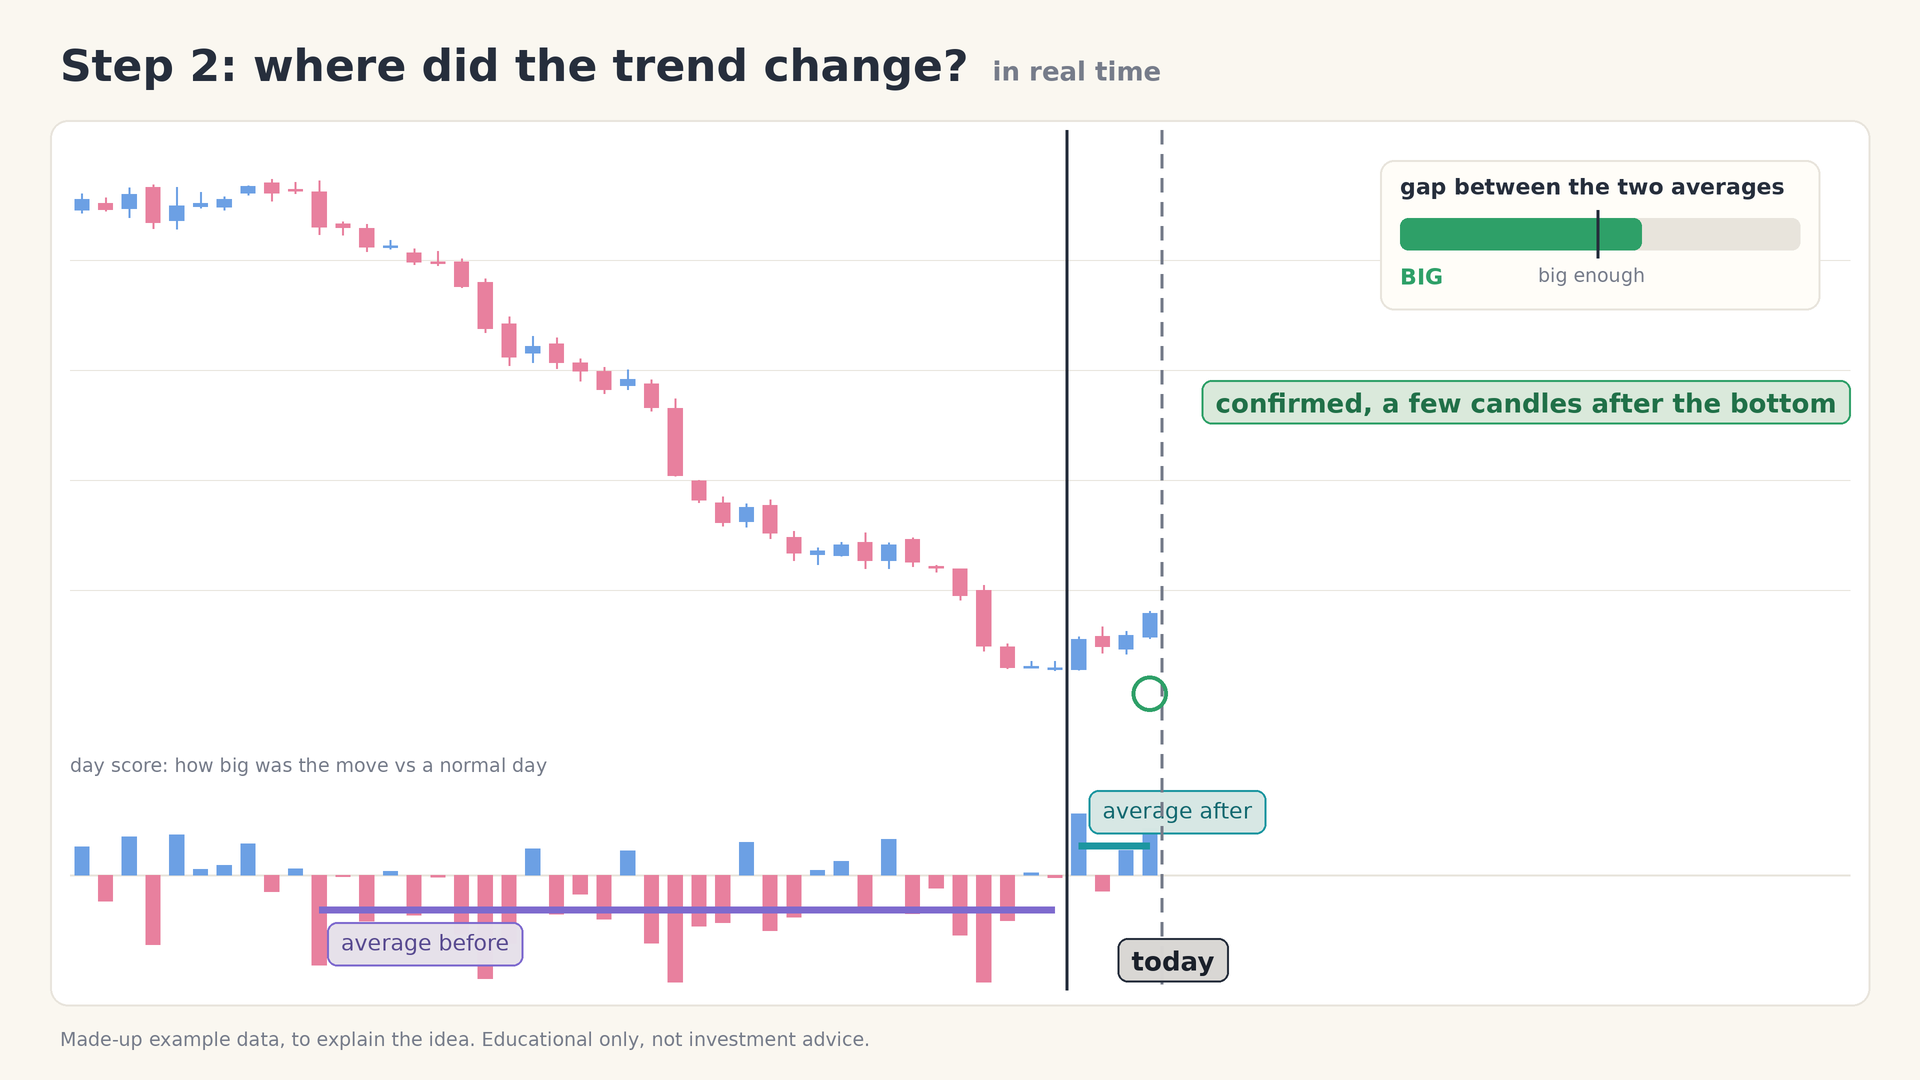
Figure 13: Real time, a few candles later: the gap is big and the change is confirmed
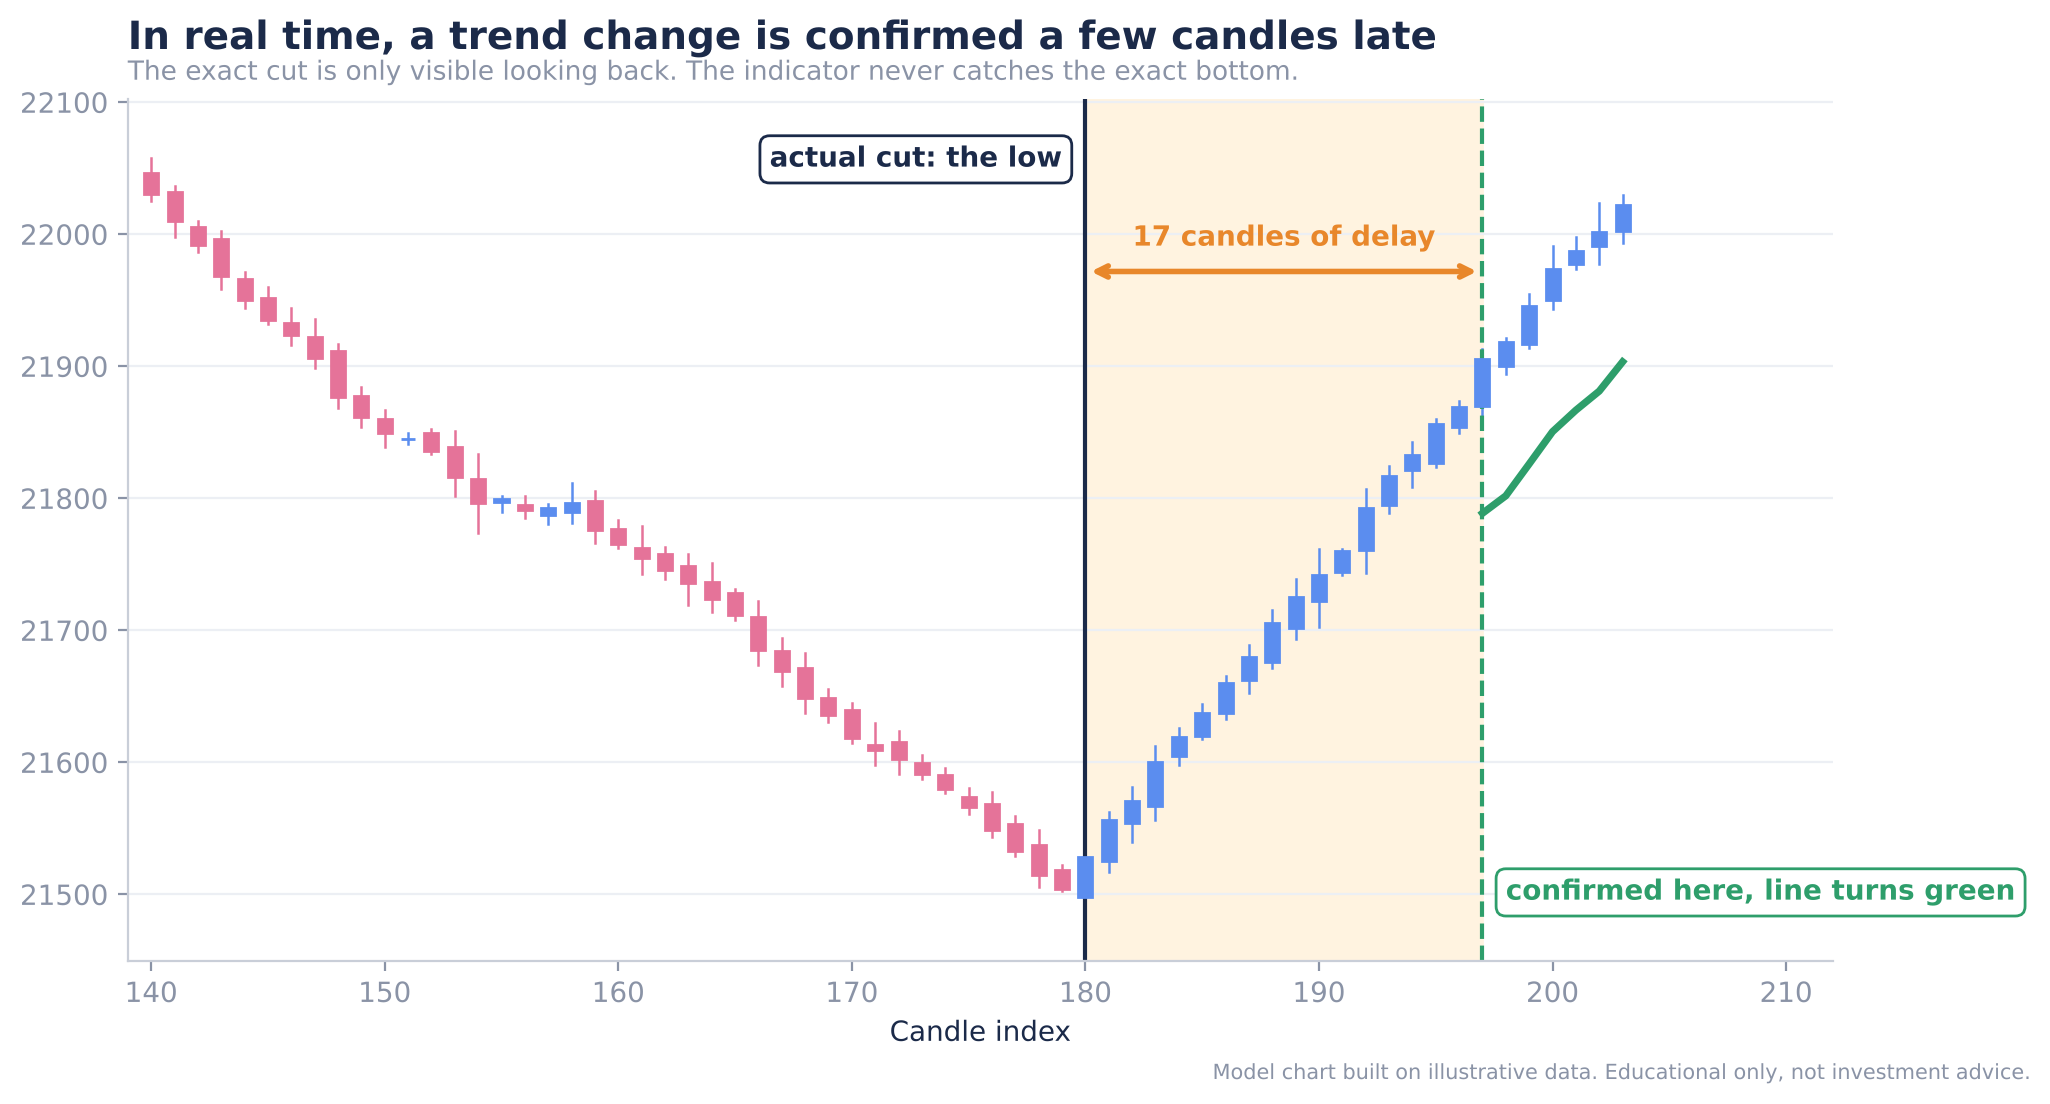
Figure 14: Model chart: the cut is at the low, but confirmation arrives later and the line turns green only then
Warning: The indicator never catches the exact bottom (or top). It spots a trend change a few candles late. This delay is the price of confirmation, because it is what prevents a single noisy candle from being mistaken for a trend.
Why one big candle is not enough
A single large candle barely moves an average that is built from many candles. It takes many days of similar behaviour to shift the average and open a real gap. That is why one big candle alone does not make the indicator declare a new trend.
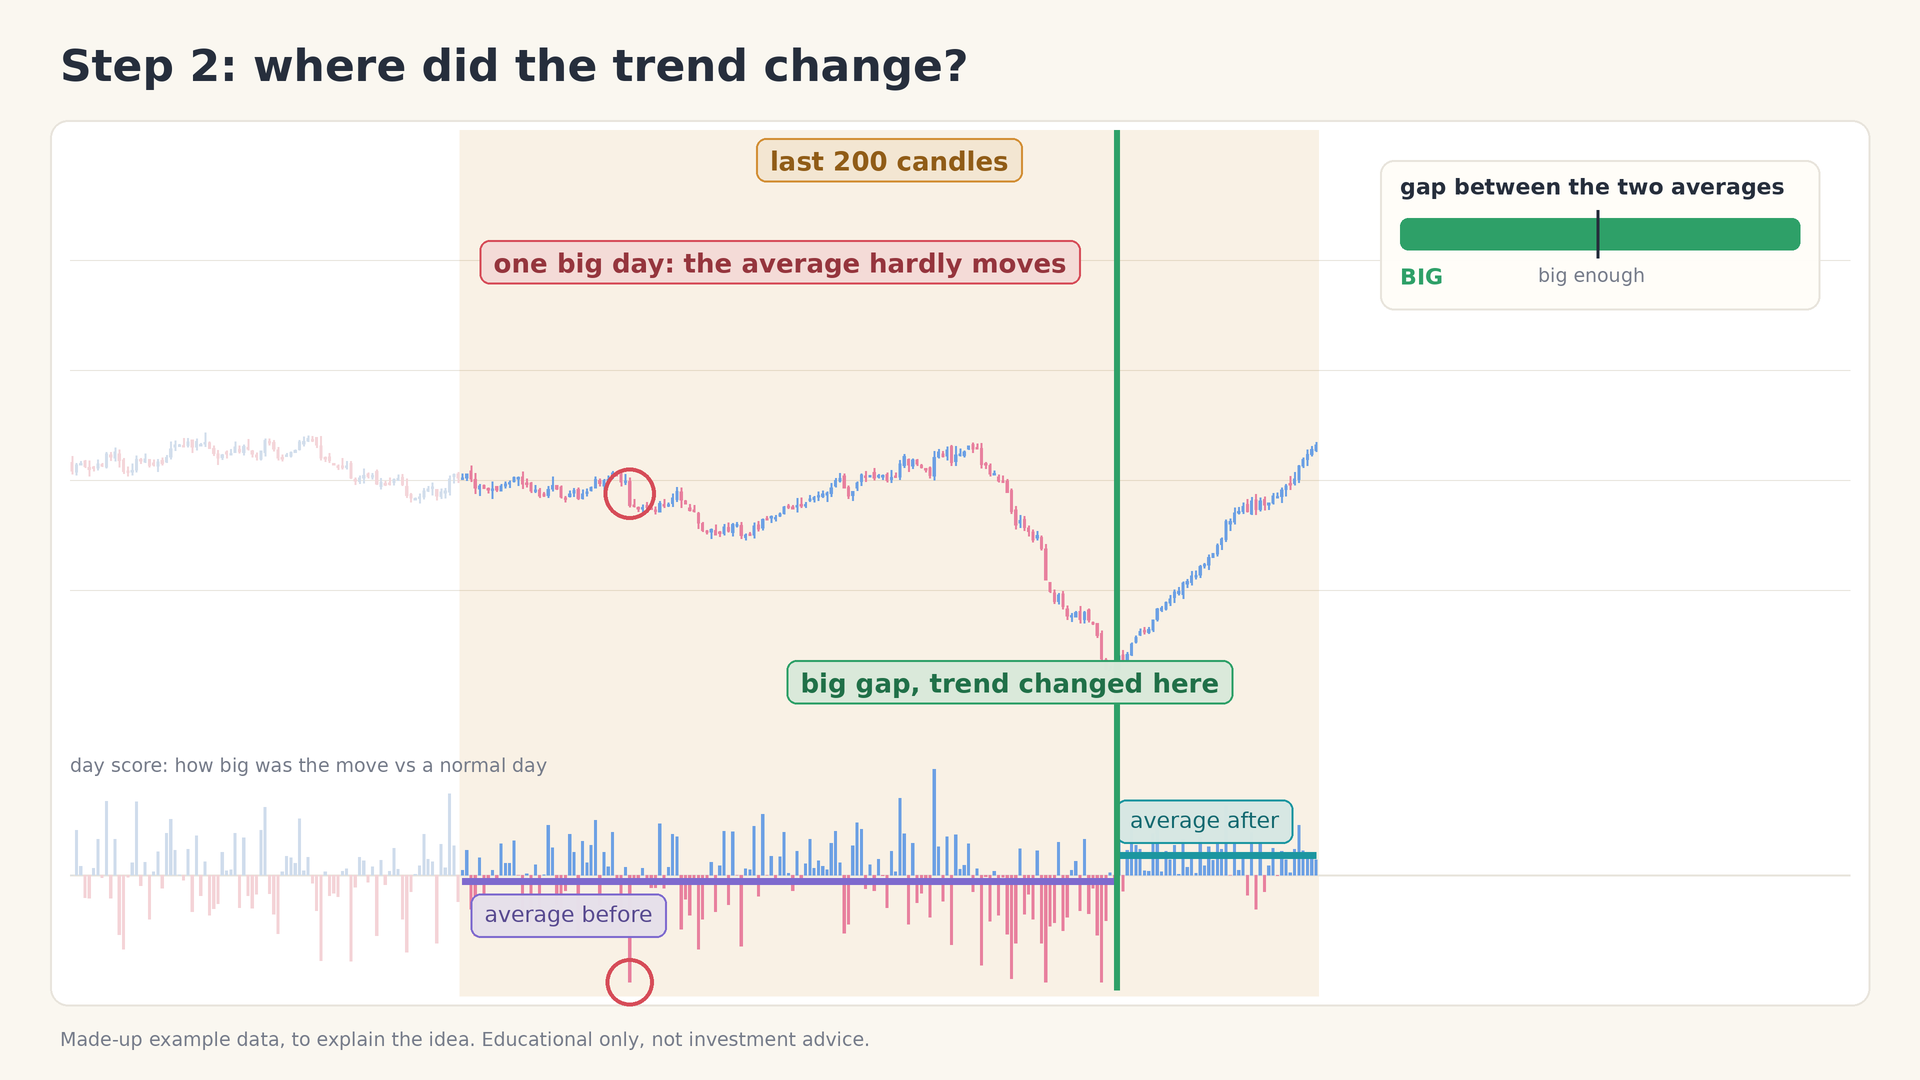
Figure 15: One big candle barely moves the average; many days together do
Expected result: The indicator has identified a confirmed point where the trend changed and can now mark it on the chart.
Step 3: Mark the Change and Ride the Trend
What to do: Mark the spot where the trend changed, then follow the trend with a line that trails price.
Why: Finding the change is only half the job. To catch the biggest part of the move, you need a way to stay in it, and to know when the trend has ended.
How it works: Once the change is confirmed, the line turns green and follows price upward. It stays a safe distance behind price. The distance is set from ATR: the line is placed a multiple of ATR away from the last close. That gap gives the trend breathing space, so that small pullbacks inside a trend do not knock you out.
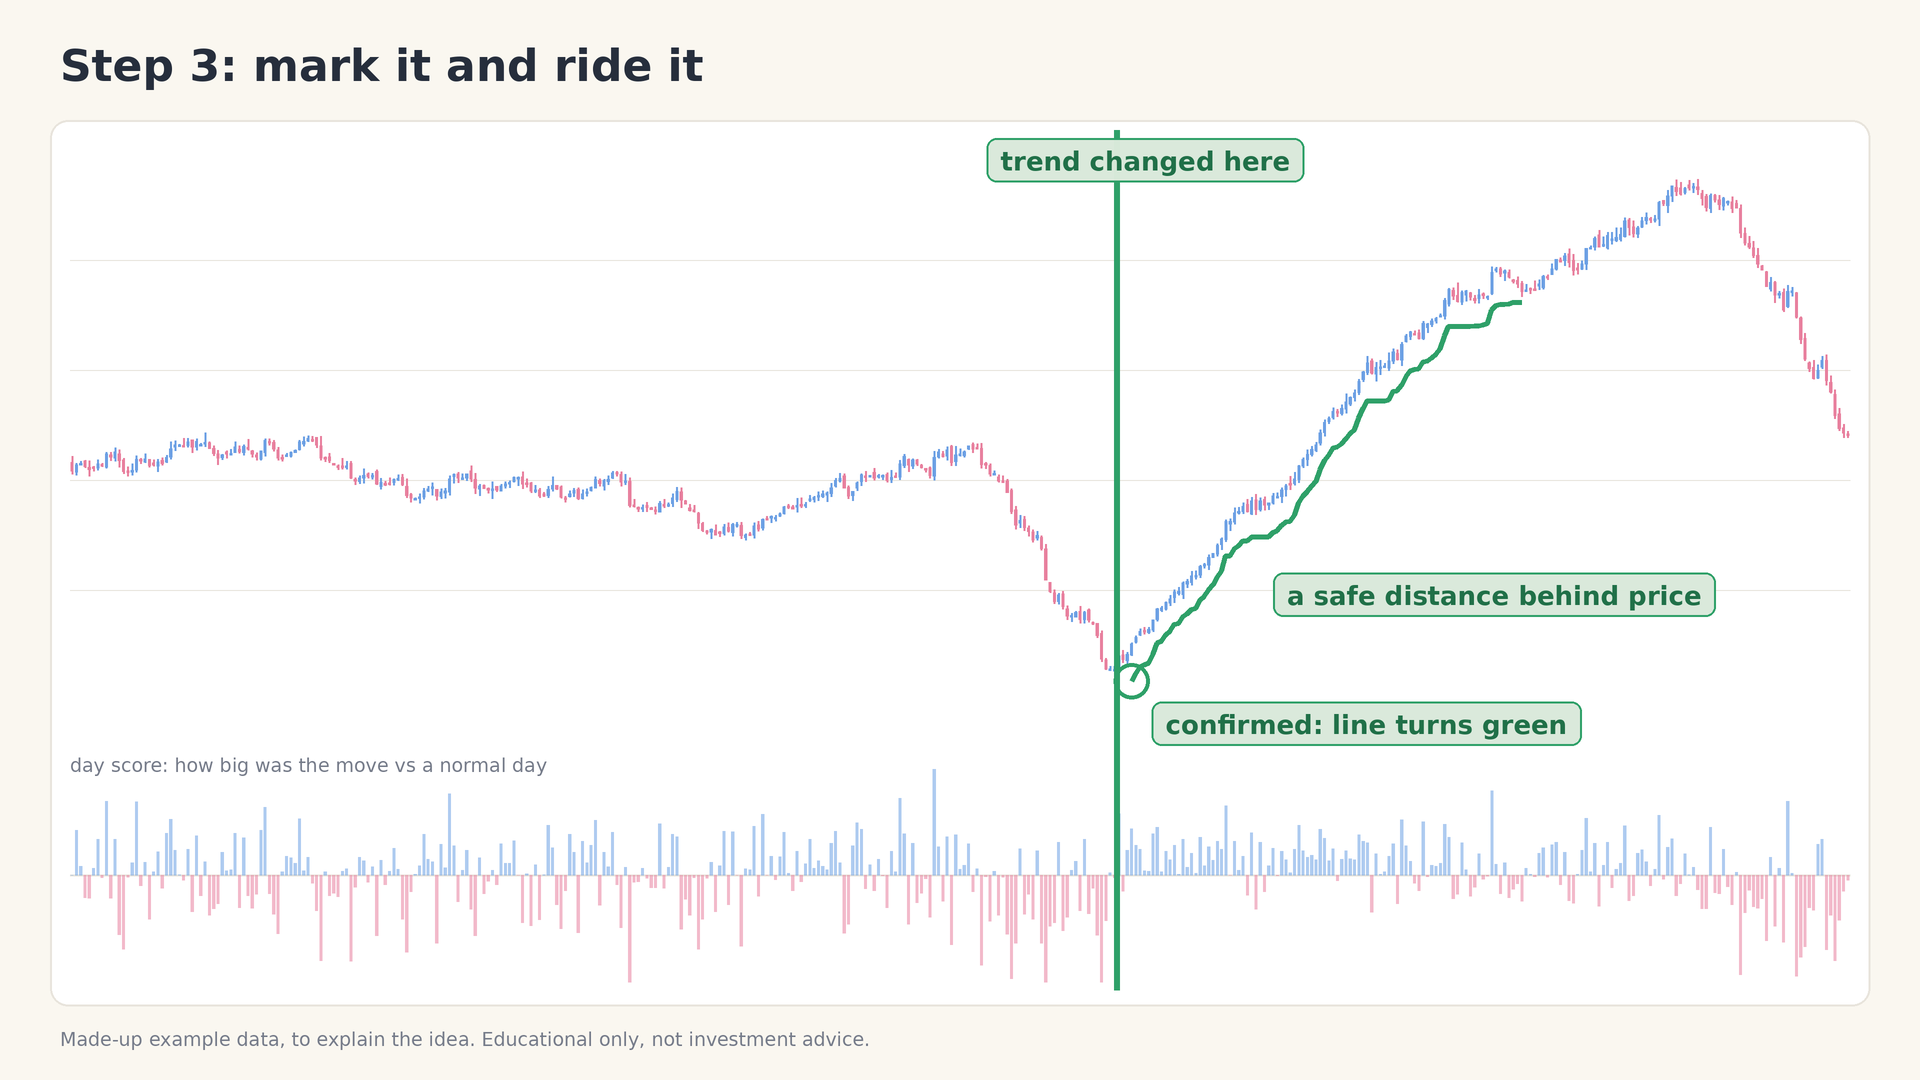
Figure 16: Confirmed: the line turns green and follows price at a safe distance
As long as price stays above the line, you stay with the trend. When a candle closes below the line, the line turns red. That tells you the trend has changed again.
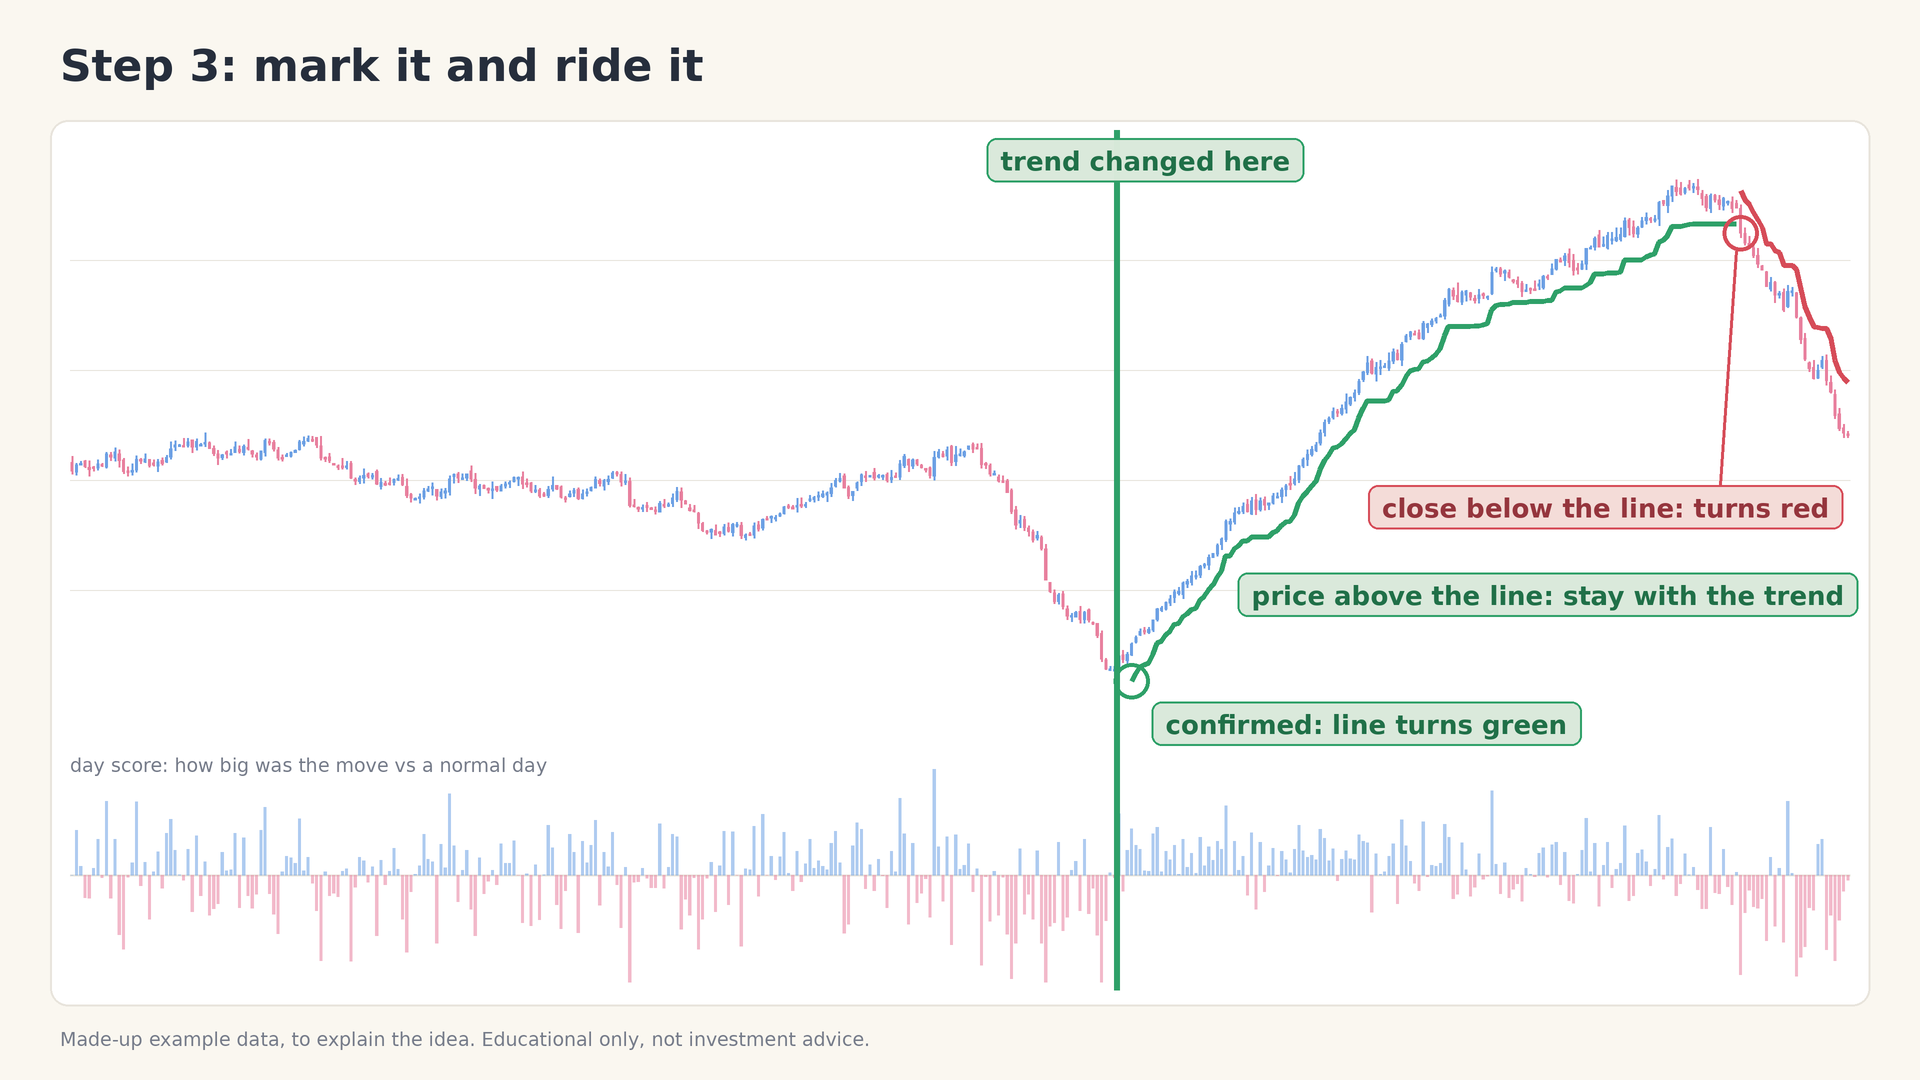
Figure 17: A close below the line turns it red, signalling a new trend change
| What you see | What it means |
|---|---|
| Vertical mark on the chart | The point where the trend changed |
| Green line below price | Confirmed uptrend: stay with the trend while price stays above the line |
| Close below the green line | The line turns red: the trend has changed again |
| Red line above price | Confirmed downtrend, trailing price from above |
Here is the whole sequence on a model candlestick chart: the change is marked, confirmation arrives, the green line trails price through the advance, and a close below the line turns it red.
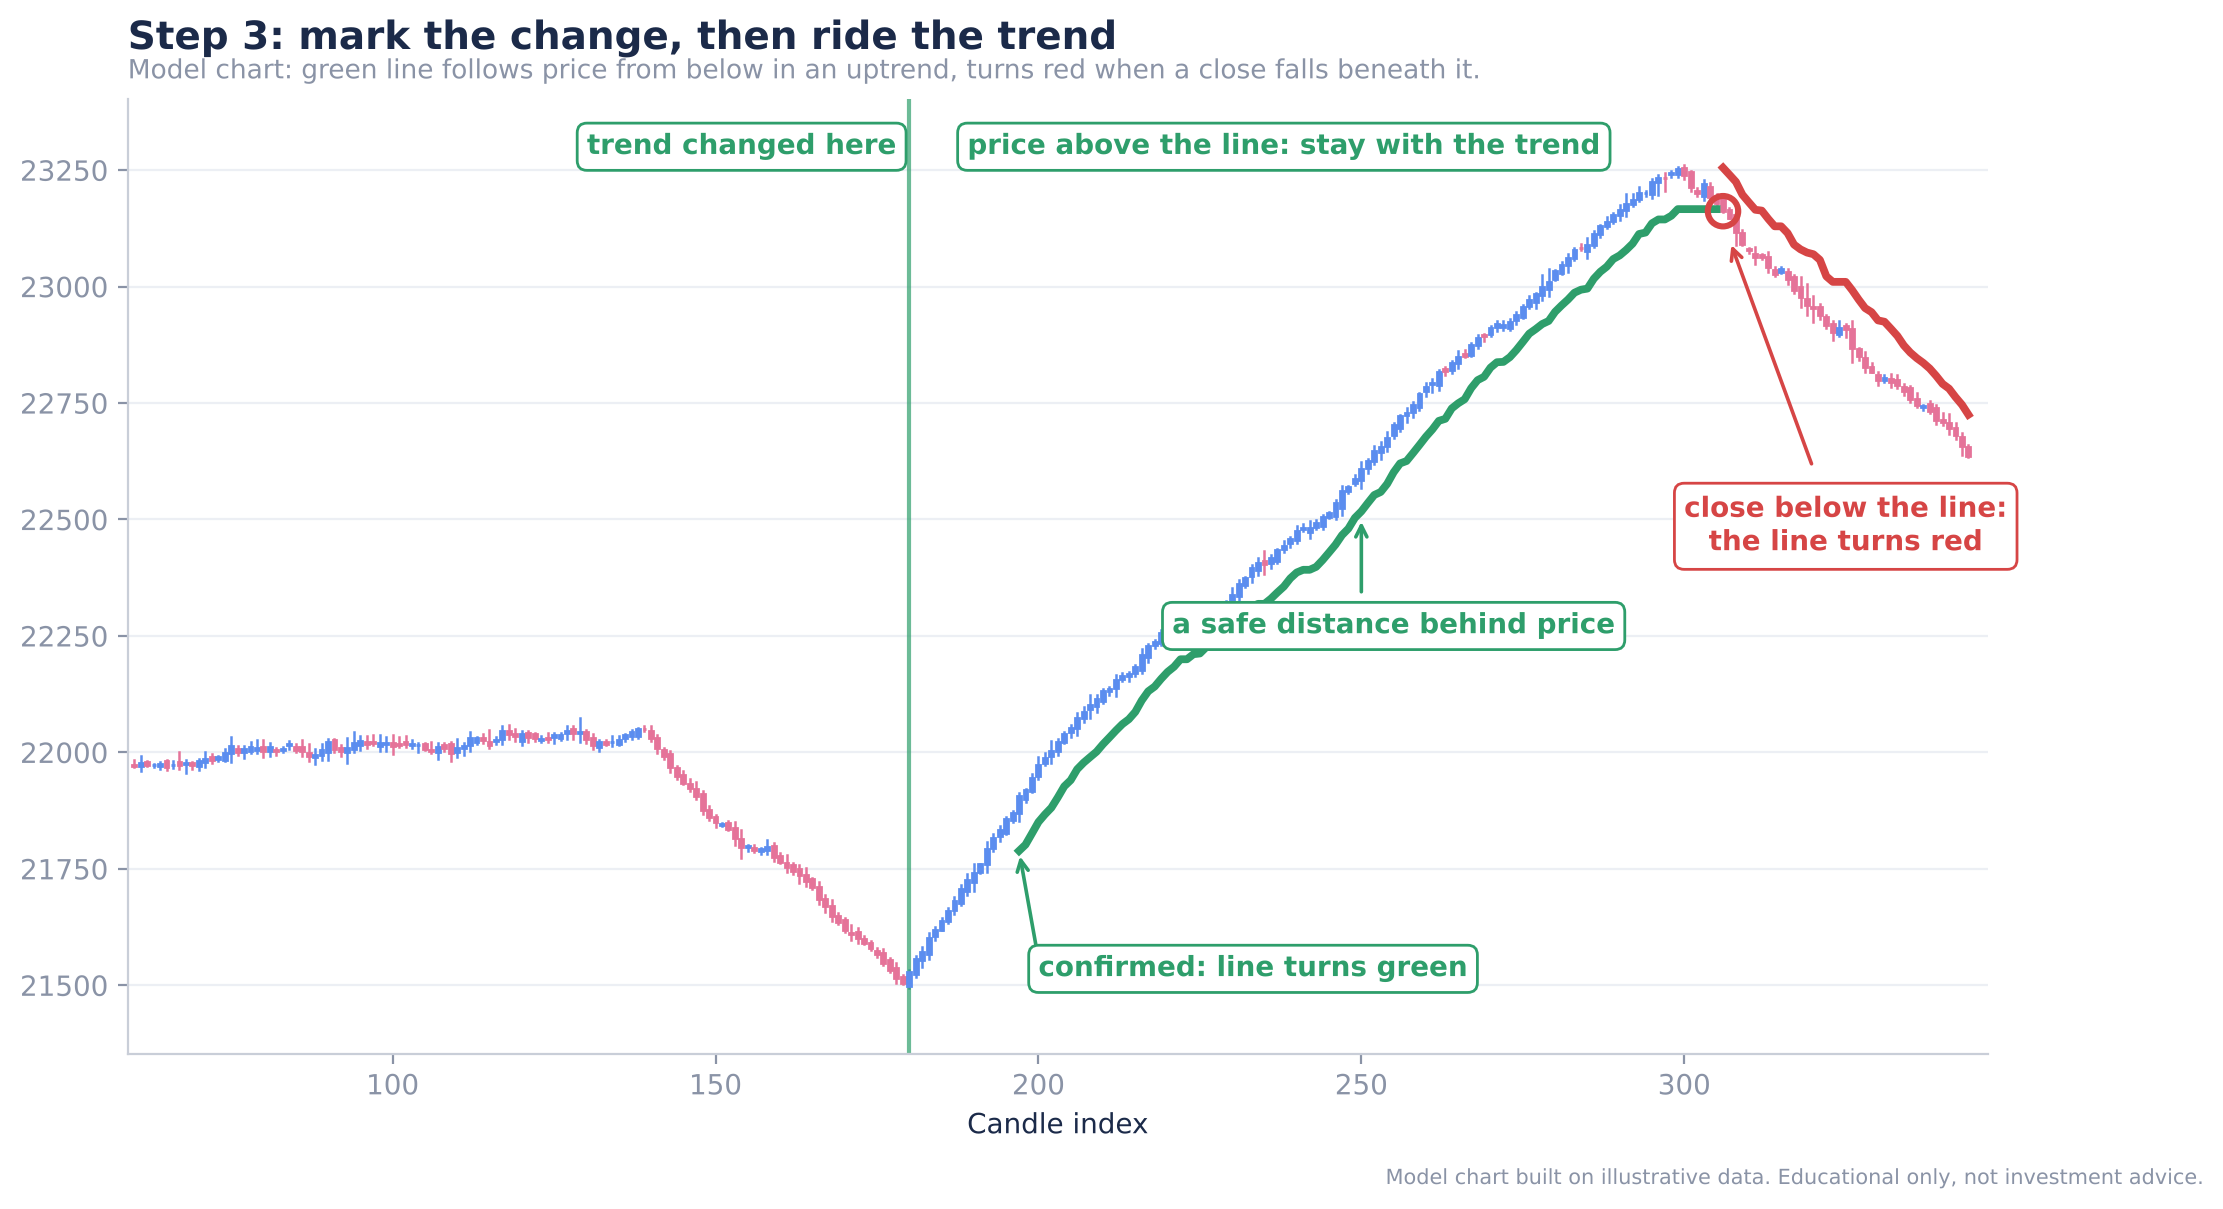
Figure 18: Model chart: mark the change, ride the trend, and exit-signal when a close falls below the line
Expected result: A clean, colour-coded line that tells you whether you are in an uptrend or a downtrend and when that has changed.
Seeing the Indicator on a Live Chart
Everything above is theory, and it has been implemented as a chart script on Dhan’s own charting platform, where you can also build your own personal indicators. Some points worth knowing when you apply it:
- It works on any timeframe. It is an indicator, so it simply reads candles, whatever their length.
- It works on any script. You can run it on Nifty, on a stock, or on an options contract.
- It is deliberately slow to commit. A popular indicator such as Supertrend may already call Nifty bullish, while TCA has not yet identified a trend it is confident about. It stays quiet until a real trend starts, and then marks it.
- It reads long declines correctly. In a long, sustained fall, the indicator portrays the downtrend accurately instead of flip-flopping.
| Ready-made indicators (Supertrend, RSI, moving averages) | TCA (Binary Segmentation) | |
|---|---|---|
| Source of the idea | Whatever is packaged and available | Your own logic, built as a chart script |
| Signal behaviour | Can call a direction early | Waits until the before/after gap is big enough |
| Customisable | Limited | Fully: the script is yours to edit |
| Timeframes and instruments | Any | Any, including options |
Why Build Your Own Indicator?
Until recently, traders worked with the indicators that standard platforms offered. If you had a new idea, there was little you could do to test it. With custom chart scripts, that has changed:
- You can design your own indicators around your own understanding of the market.
- You can test new ideas on a real chart instead of only imagining them.
- You are no longer restricted to ready-made indicators.
Binary Segmentation is a first attempt, version one. If it works well, it can be improved further. Catching trends matters whichever way you trade: an option seller has to catch the theta decay trend, and a breakout trader has to catch a very short-term trend. A better trend-catching tool helps in both cases.
Whatever your idea is, you can turn it into an indicator and then use it in a much better manner.
Getting the Indicator onto Your Dhan Chart
The complete chart script for Binary Segmentation is shared through MadeForTrade. The flow below shows the whole path, and the steps after it explain each action.
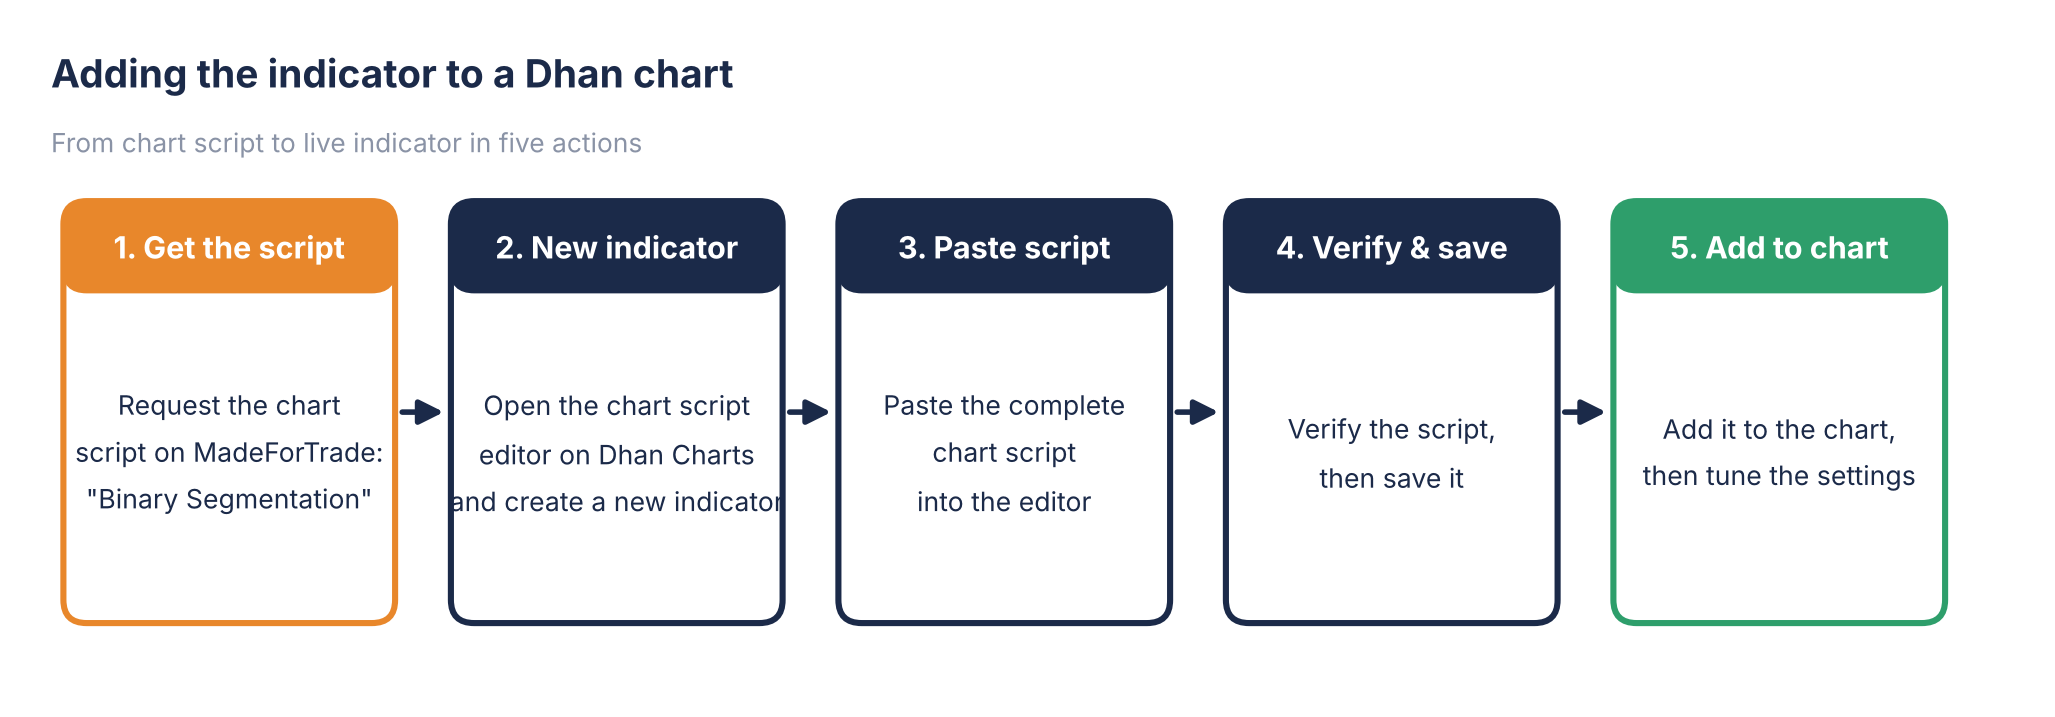
Figure 19: From chart script to live indicator on your Dhan chart
Setup Step 1: Create an account on MadeForTrade
Open MadeForTrade and create an account. This is where the indicator’s script is shared. Expected result: you are signed in and can post.
Setup Step 2: Ask for the indicator
Click Share your thoughts, and post that you want the trend-catching indicator named Binary Segmentation. Expected result: your request is posted and gets a reply.
Setup Step 3: Receive the link
You will be sent a direct link that contains the complete chart script. Expected result: you can open the script and copy all of it.
Setup Step 4: Create a new indicator on Dhan Charts
On Dhan Charts, create a new indicator and paste the entire chart script into the editor. Expected result: the editor shows the full script.
Setup Step 5: Verify, save and add to chart
Click Verify to check the script, then Save, then Add to chart. Expected result: the Binary Segmentation indicator appears on your chart and you can start using it straight away.
Setup Step 6: Tune the settings
The indicator lets you decide two things:
- How closely you follow the trend. Stay very close to the trend, or follow it more slowly.
- How far the line sits from price. This is the distance you keep from the market when you trail a position.
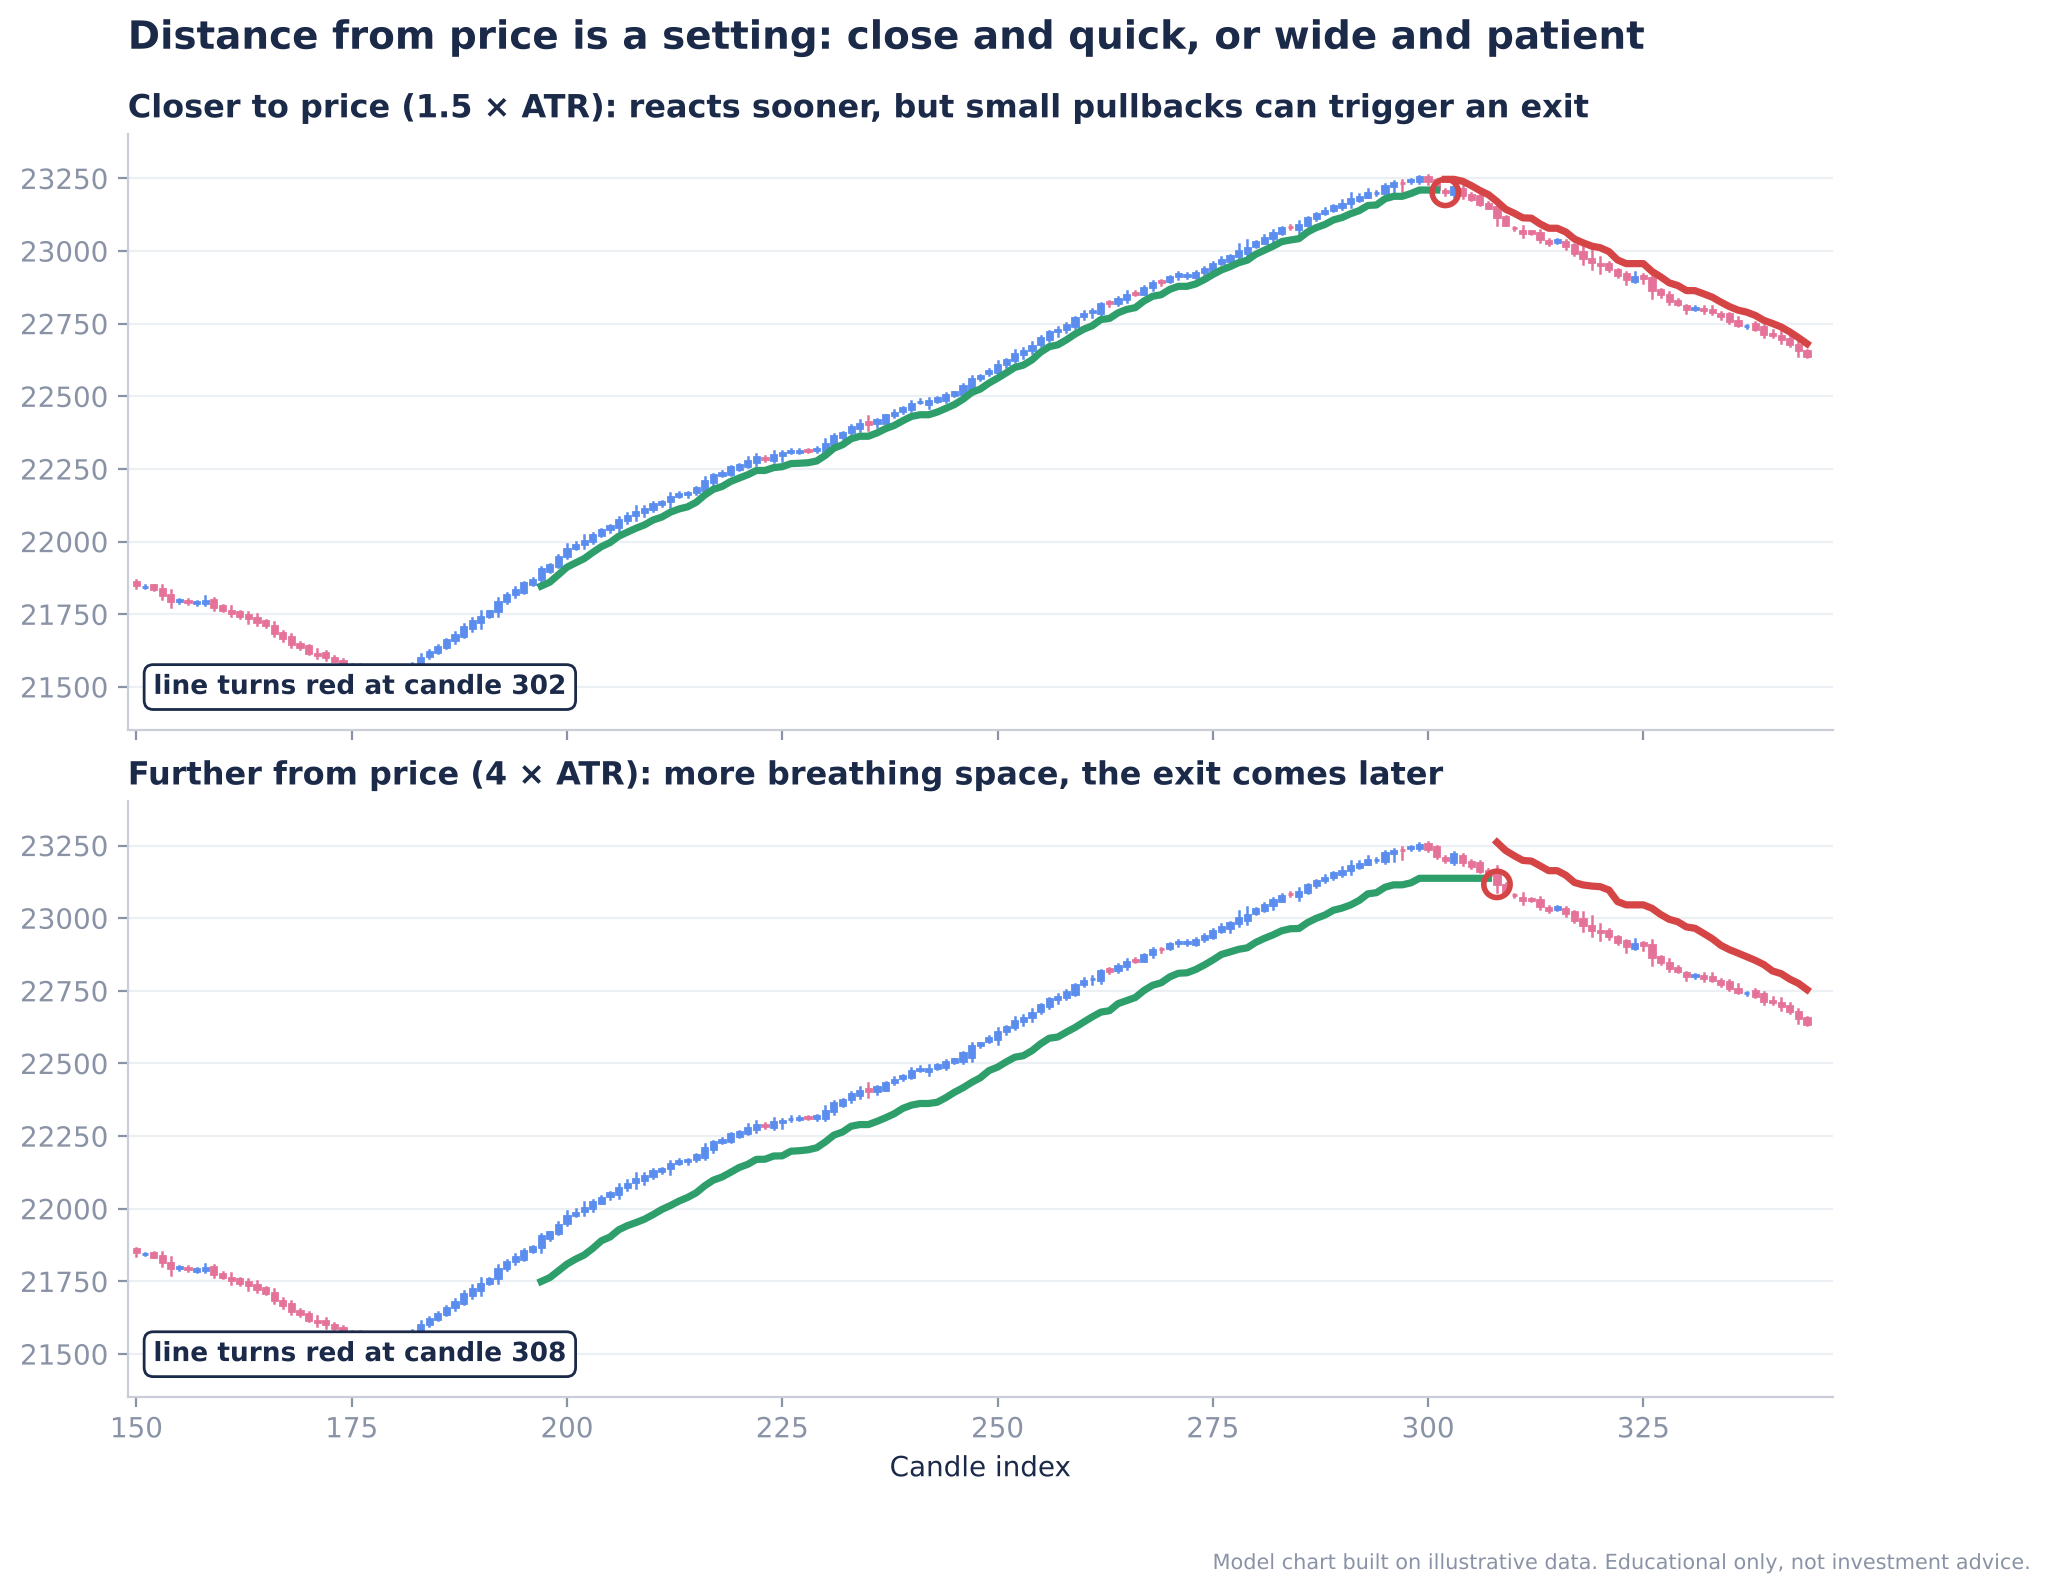
Figure 20: Model chart: the same trend with the line closer to price (top) and further from price (bottom)
| Setting direction | Behaviour | Best suited to |
|---|---|---|
| Line closer to price | Reacts sooner; small pullbacks can trigger a change | Shorter-term trades |
| Line further from price | More breathing space; the exit comes later | Staying with bigger trends |
Summary
- Catching more of a trend is the core problem in almost every style of trading: trend following, momentum, breakouts and option selling.
- Binary Segmentation compares the candles before and after every possible point in the last 200 candles, and marks a trend change when the difference is big enough.
- Step 1 scores every candle against a normal candle. Step 2 finds where the trend really changed. Step 3 marks it and rides it with an ATR-based trailing line.
- Confirmation always arrives a few candles late; the indicator does not catch the exact bottom or top.
- The line turns green when an uptrend is confirmed and red when a close falls below it.
- It works on any timeframe and any instrument, and you can tune how close the line follows price.
- This is version one, and building your own indicators on Dhan Charts means ideas like this can keep improving.