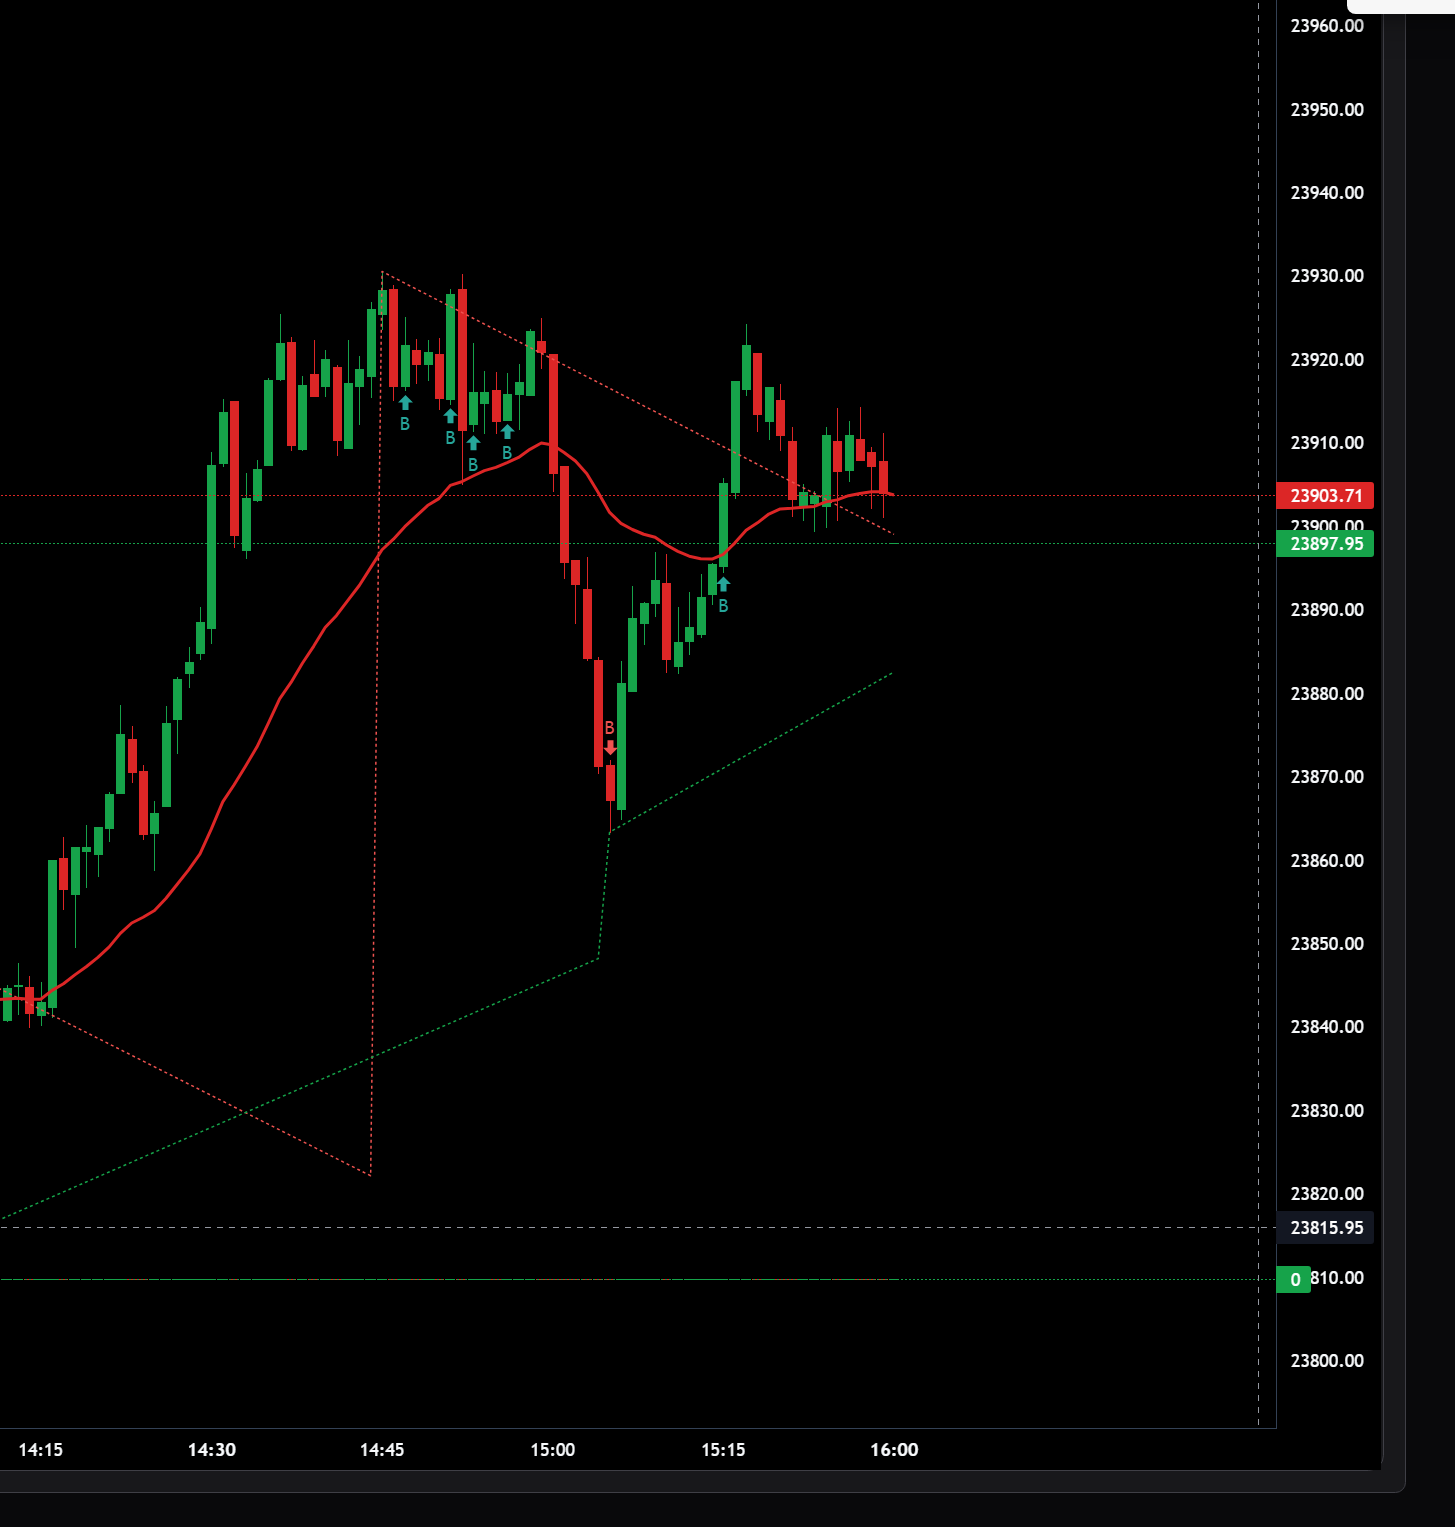
Can you add Trendlines With Breaks [LUX] on dhan tv chart? pinescript I copied from tradingview and pasted below. @PravinJ
// This work is licensed under a Attribution-NonCommercial-ShareAlike 4.0 International (CC BY-NC-SA 4.0) https://creativecommons.org/licenses/by-nc-sa/4.0/
// © LuxAlgo

//@version=5
indicator("Trendlines With Breaks [LUX]",overlay=true)
length = input.int(14)
k      = input.float(1.,'Slope',minval=0,step=.1)
method = input.string('Atr','Slope Calculation Method',
  options=['Atr','Stdev','Linreg'])
show   = input(false,'Show Only Confirmed Breakouts')
//----
upper = 0.,lower = 0.
slope_ph = 0.,slope_pl = 0.
src = close
n = bar_index
//----
ph = ta.pivothigh(length,length)
pl = ta.pivotlow(length,length)
slope = switch method
    'Atr'      => ta.atr(length)/length*k
    'Stdev'    => ta.stdev(src,length)/length*k
    'Linreg'   => math.abs(ta.sma(src*bar_index,length)-ta.sma(src,length)*ta.sma(bar_index,length))/ta.variance(n,length)/2*k

slope_ph := ph ? slope : slope_ph[1]
slope_pl := pl ? slope : slope_pl[1]

upper := ph ? ph : upper[1] - slope_ph
lower := pl ? pl : lower[1] + slope_pl
//----
single_upper = 0
single_lower = 0
single_upper := src[length] > upper ? 0 : ph ? 1 : single_upper[1]
single_lower := src[length] < lower ? 0 : pl ? 1 : single_lower[1]
upper_breakout = single_upper[1] and src[length] > upper and (show ? src > src[length] : 1)
lower_breakout = single_lower[1] and src[length] < lower and (show ? src < src[length] : 1)
plotshape(upper_breakout ? low[length] : na,"Upper Break",shape.labelup,location.absolute,#26a69a,-length,text="B",textcolor=color.white,size=size.tiny)
plotshape(lower_breakout ? high[length] : na,"Lower Break",shape.labeldown,location.absolute,#ef5350,-length,text="B",textcolor=color.white,size=size.tiny)
//----
var line up_l = na
var line dn_l = na
var label recent_up_break = na
var label recent_dn_break = na

if ph[1]
    line.delete(up_l[1])
    label.delete(recent_up_break[1])

    up_l := line.new(n-length-1,ph[1],n-length,upper,color=#26a69a,
      extend=extend.right,style=line.style_dashed)
if pl[1]
    line.delete(dn_l[1])
    label.delete(recent_dn_break[1])

    dn_l := line.new(n-length-1,pl[1],n-length,lower,color=#ef5350,
      extend=extend.right,style=line.style_dashed)

if ta.crossover(src,upper-slope_ph*length)
    label.delete(recent_up_break[1])
    recent_up_break := label.new(n,low,'B',color=#26a69a,
      textcolor=color.white,style=label.style_label_up,size=size.small)

if ta.crossunder(src,lower+slope_pl*length)
    label.delete(recent_dn_break[1])
    recent_dn_break := label.new(n,high,'B',color=#ef5350,
      textcolor=color.white,style=label.style_label_down,size=size.small)

//----
plot(upper,'Upper',color = ph ? na : #26a69a,offset=-length)
plot(lower,'Lower',color = pl ? na : #ef5350,offset=-length)

alertcondition(ta.crossover(src,upper-slope_ph*length),'Upper Breakout','Price broke upper trendline')
alertcondition(ta.crossunder(src,lower+slope_pl*length),'Lower Breakout','Price broke lower trendline')