Hi @Everyone,
Scalping only works when the setup is exceptionally strong. Since most scalping trades play out fast, often within 20 to 25 minutes, a weak level can ruin the entire trade. That is why one of the cleanest ways to build a high probability intraday setup is to stop relying only on standard chart tools and start tracking where real positions are sitting in the options market.
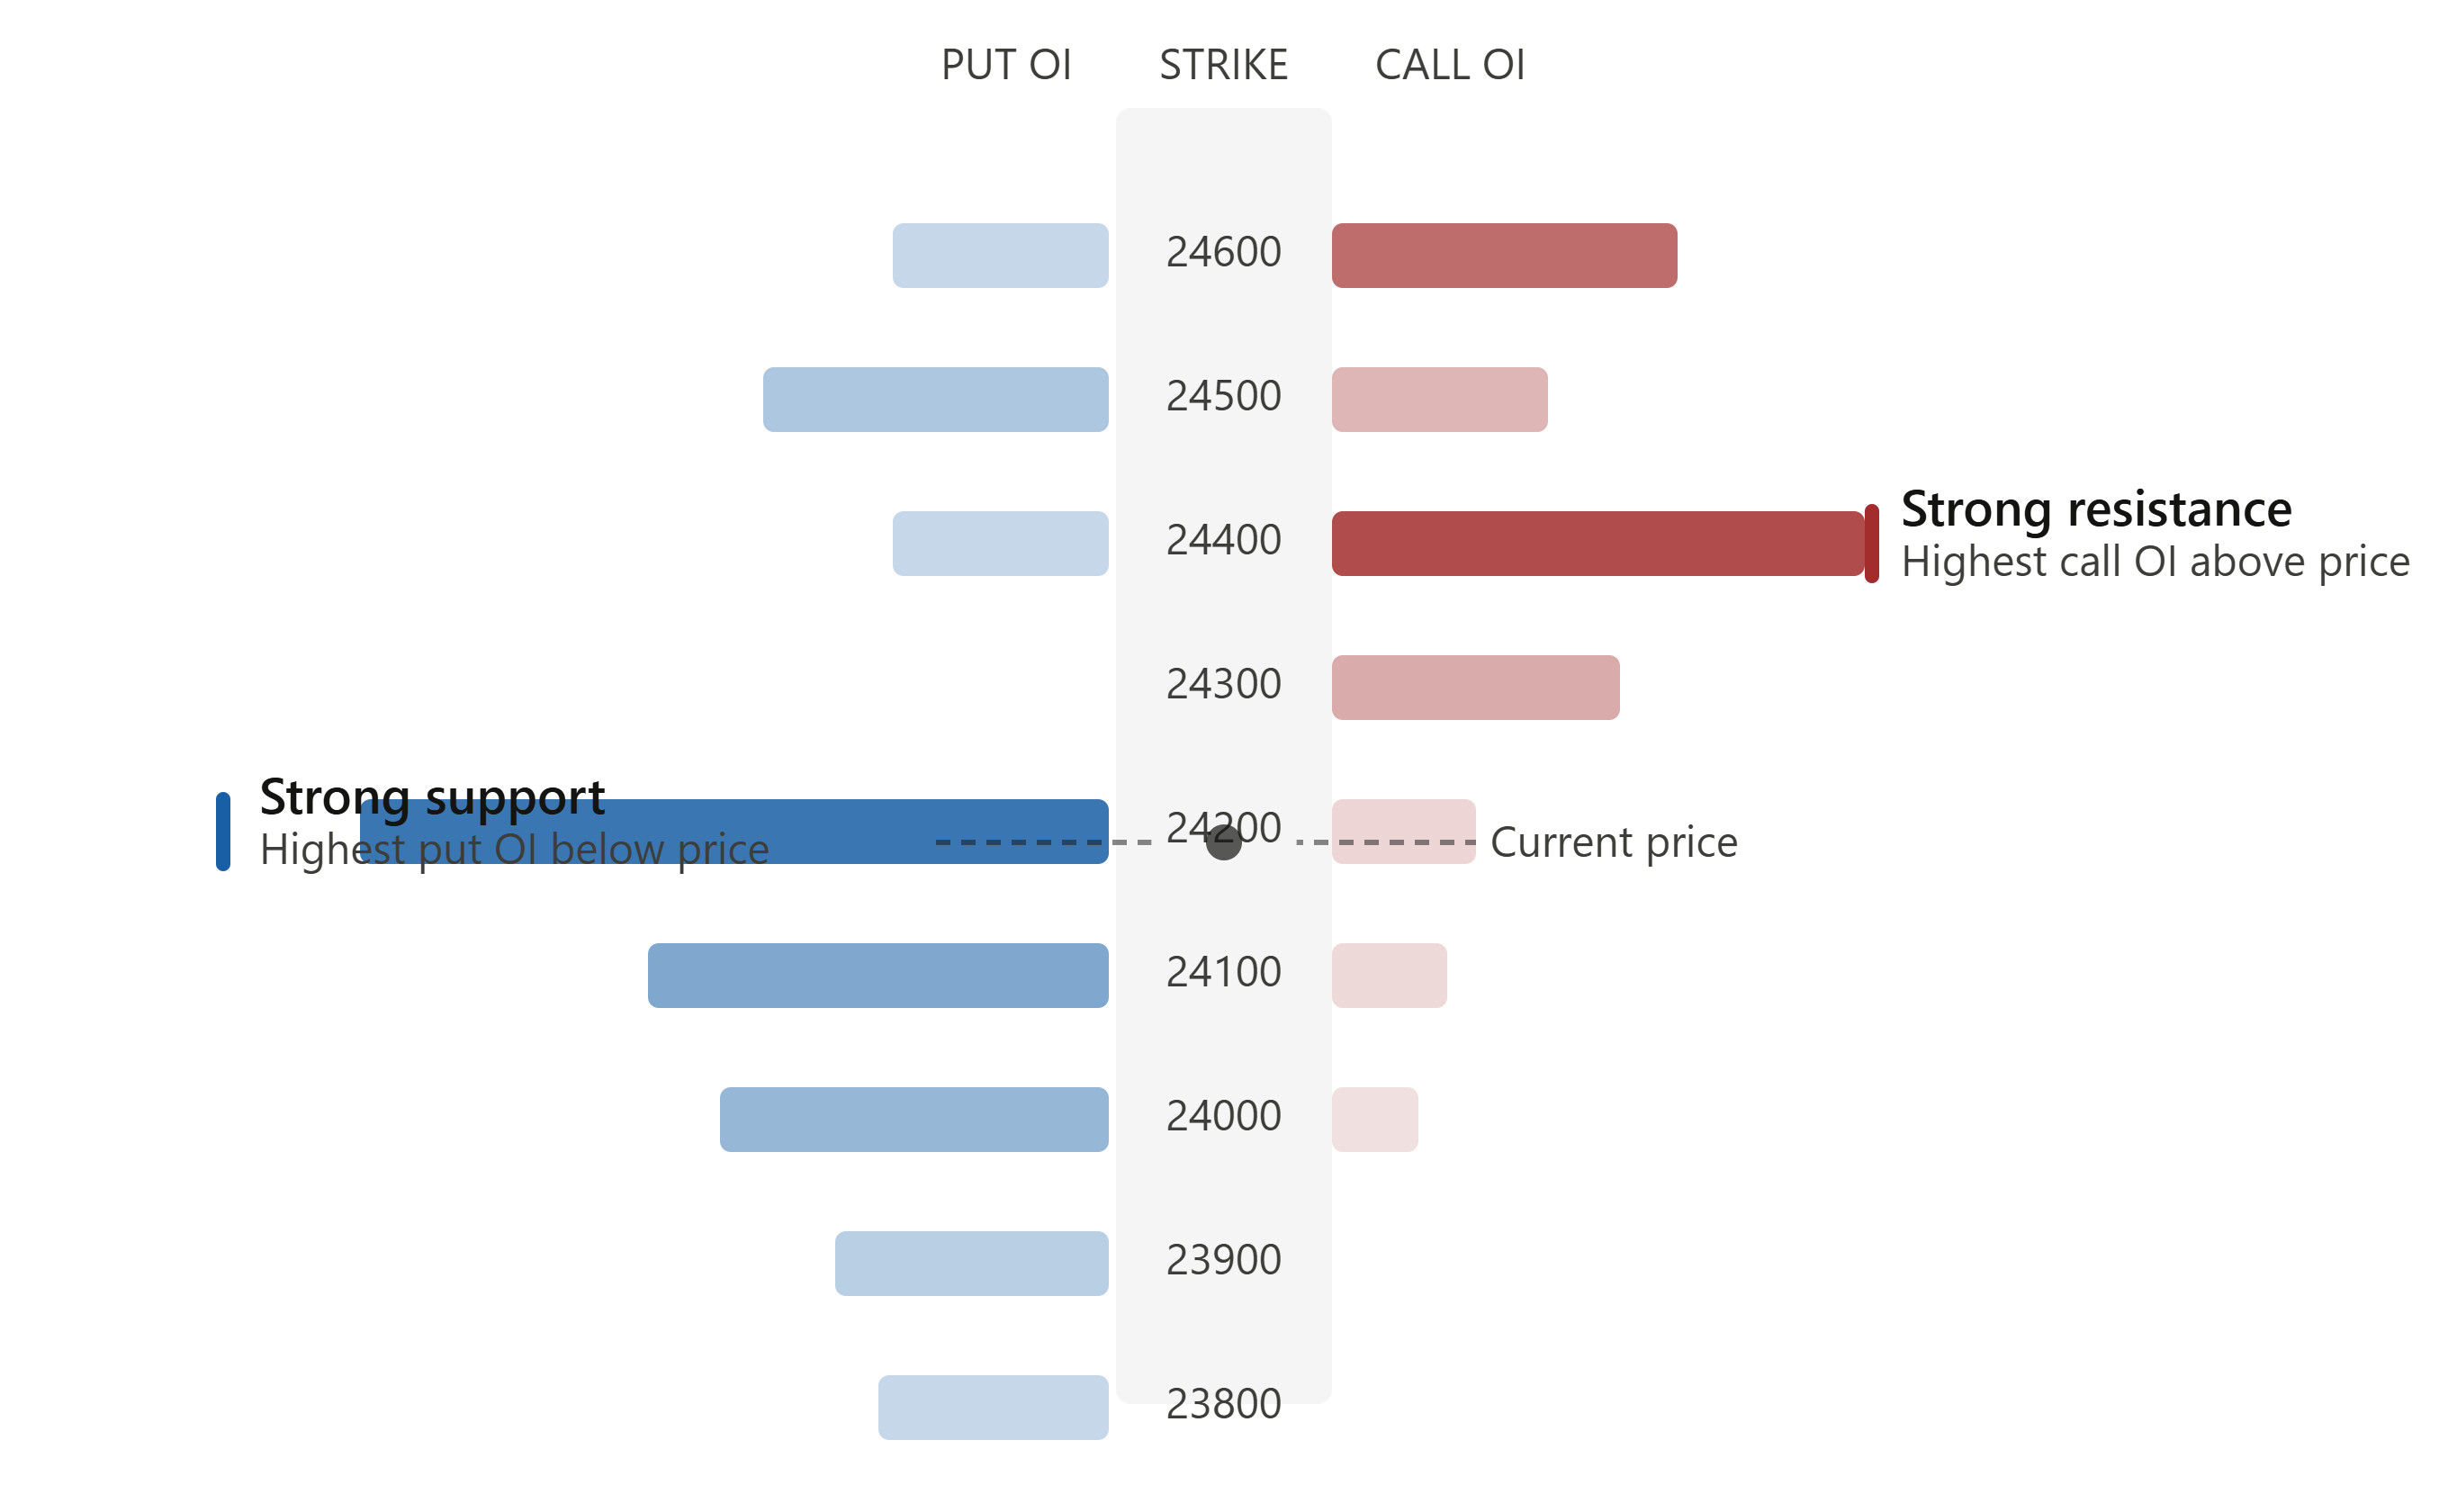
The key idea is simple. Open interest helps us identify where large market participants are positioned . Once we know that, we can mark stronger support and resistance zones, define tighter risk, and build a far more practical scalping framework.
Why open interest matters for scalping
Open interest represents total active positions in a contract. In practical terms, it reflects where buyers and sellers have created positions in the options chain. Since large participants often take the selling side of options, heavy open interest at certain strikes can reveal levels they are likely to defend.
That becomes incredibly useful for intraday trading.
-
High call open interest above price often acts as resistance.
-
High put open interest below price often acts as support.
-
Larger concentrations tend to be more meaningful than smaller ones.
Instead of randomly drawing lines on a chart and hoping they matter, we can use option positioning to first identify the levels, then confirm them with price action.
How to read support and resistance from open interest
-
The working rule is straightforward.
-
If call open interest is far larger than put open interest at a strike, that zone can behave like resistance. If put open interest is much larger, that zone can behave like support.
-
For example, if a strike shows very heavy call open interest while nearby put open interest is relatively small, that suggests strong positioning from call sellers. That strike becomes a candidate resistance level. On the other hand, if a lower strike has heavy put open interest, it becomes a candidate support level.
-
But there is one important condition.
-
Only treat levels above current price as resistance and levels below current price as support. A strike may have large call open interest, but if price is already below it in a way that makes the level irrelevant for the current move, it should not automatically be used in the setup.
Why these levels are often stronger than ordinary chart lines
-
Many traders draw support and resistance using recent highs, lows, pivot points, or trend lines. Those tools can help, but they usually do not tell us how much actual positioning exists at a level.
-
That is the main advantage of open interest.
-
It does not just show where a line can be drawn. It gives us a clue about where money is concentrated .
-
When we compare multiple levels, open interest also helps us rank them. We can often tell which resistance is stronger simply by checking where the biggest call open interest sits. The same applies to support using puts.
-
That is much harder to do with ordinary pivot points. If someone asks whether R3 is stronger than R4, or whether one support is more meaningful than another, a normal pivot system does not really give a convincing answer. Open interest does.
Cross checking open interest with technical analysis
Open interest becomes even more useful when price action confirms it.
Suppose we identify a resistance from a heavy call open interest strike. Then we look left on the chart and see that price has already reversed from that zone before. Maybe it has produced one clean rejection, then another. Maybe a large red candle formed from that region earlier. That tells us the same thing from two different angles:
-
Options positioning says the level is important.
-
Price action says the level has already behaved like resistance.
That combination creates a much stronger scalping setup.
The same process works for support. If a strike has large put open interest and historical price action shows multiple bounces from that area, the level becomes far more reliable than a line drawn without context.
What is really happening behind high call open interest
To understand why these levels work, we need to understand what open interest actually means.
An open interest position is created when a buyer and a seller complete a trade in an options contract. One side buys, the other side sells, and that transaction adds to open interest.
Now comes the important part.
In options markets, the seller usually has more capital at stake than the buyer. A buyer may pay a relatively small premium to purchase the option. The seller, however, typically carries a much larger margin obligation. That means the seller often has more reason to defend the strike.
Who is frequently on the selling side?
Not usually small retail traders. In many cases, it is the market makers, dealers, and large firms whose core role is to provide liquidity and take the opposite side of trades. If there is very large call open interest at a strike, it suggests substantial call selling has happened there. Those participants generally prefer price to stay below that strike.
That is why heavy call open interest can act like a defended ceiling . If price starts moving toward that level, those positions can create resistance. Likewise, heavy put open interest can create support.
How a real scalp setup forms around these levels
Once we mark the major open interest zones, the trade plan becomes simple.
Let us say price approaches a resistance created by a large call open interest strike. If price reaches the zone and starts hesitating, rejecting, or printing indecisive candles such as a doji, that can signal defense at the level.
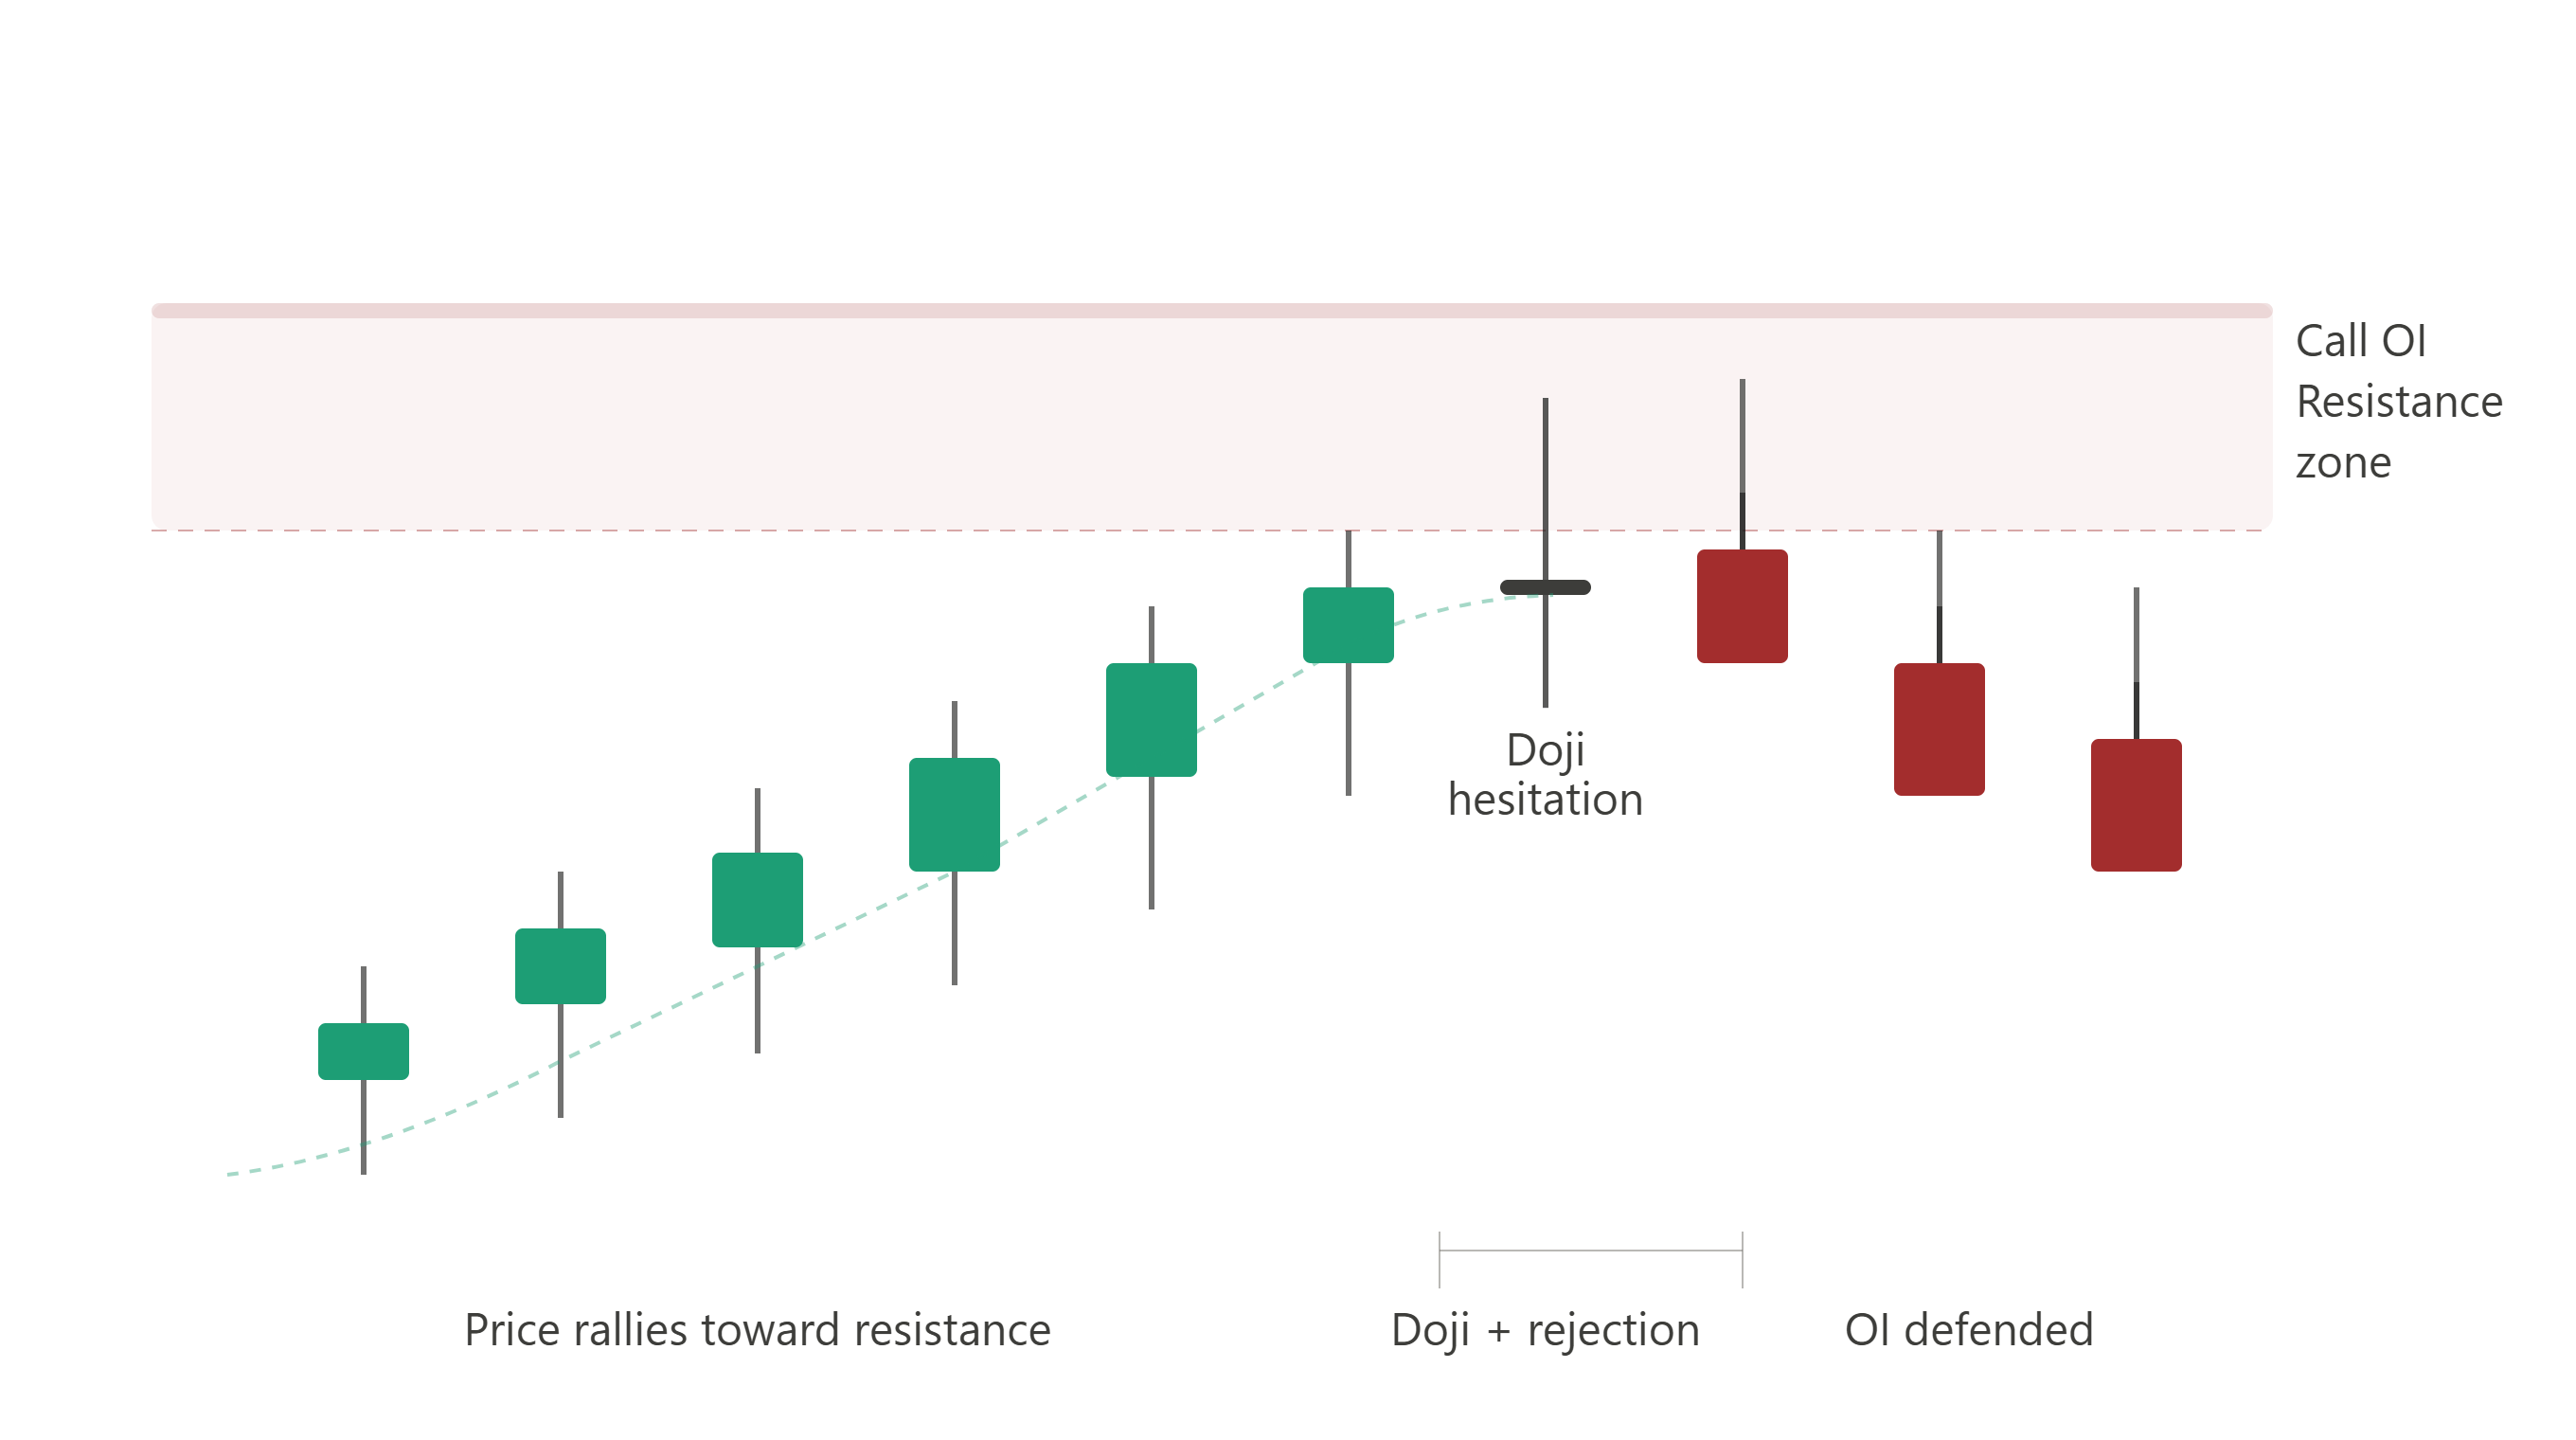
The logic behind the hesitation is straightforward. If a large number of call sellers are positioned there, they have incentive to keep price from breaking above it. As that defense appears on the chart, it can create an opportunity for a short duration scalp.
What matters is not guessing in advance. What matters is waiting for price to react at a strong, position backed level.
A practical way to place stop loss and target
One clean method is to use nearby open interest levels themselves for risk management.
-
Entry: Near the identified support or resistance after price reaction confirms the level.
-
Stop loss: Around the next open interest level beyond the zone.
-
Target: Around one or two major open interest levels in the opposite direction.
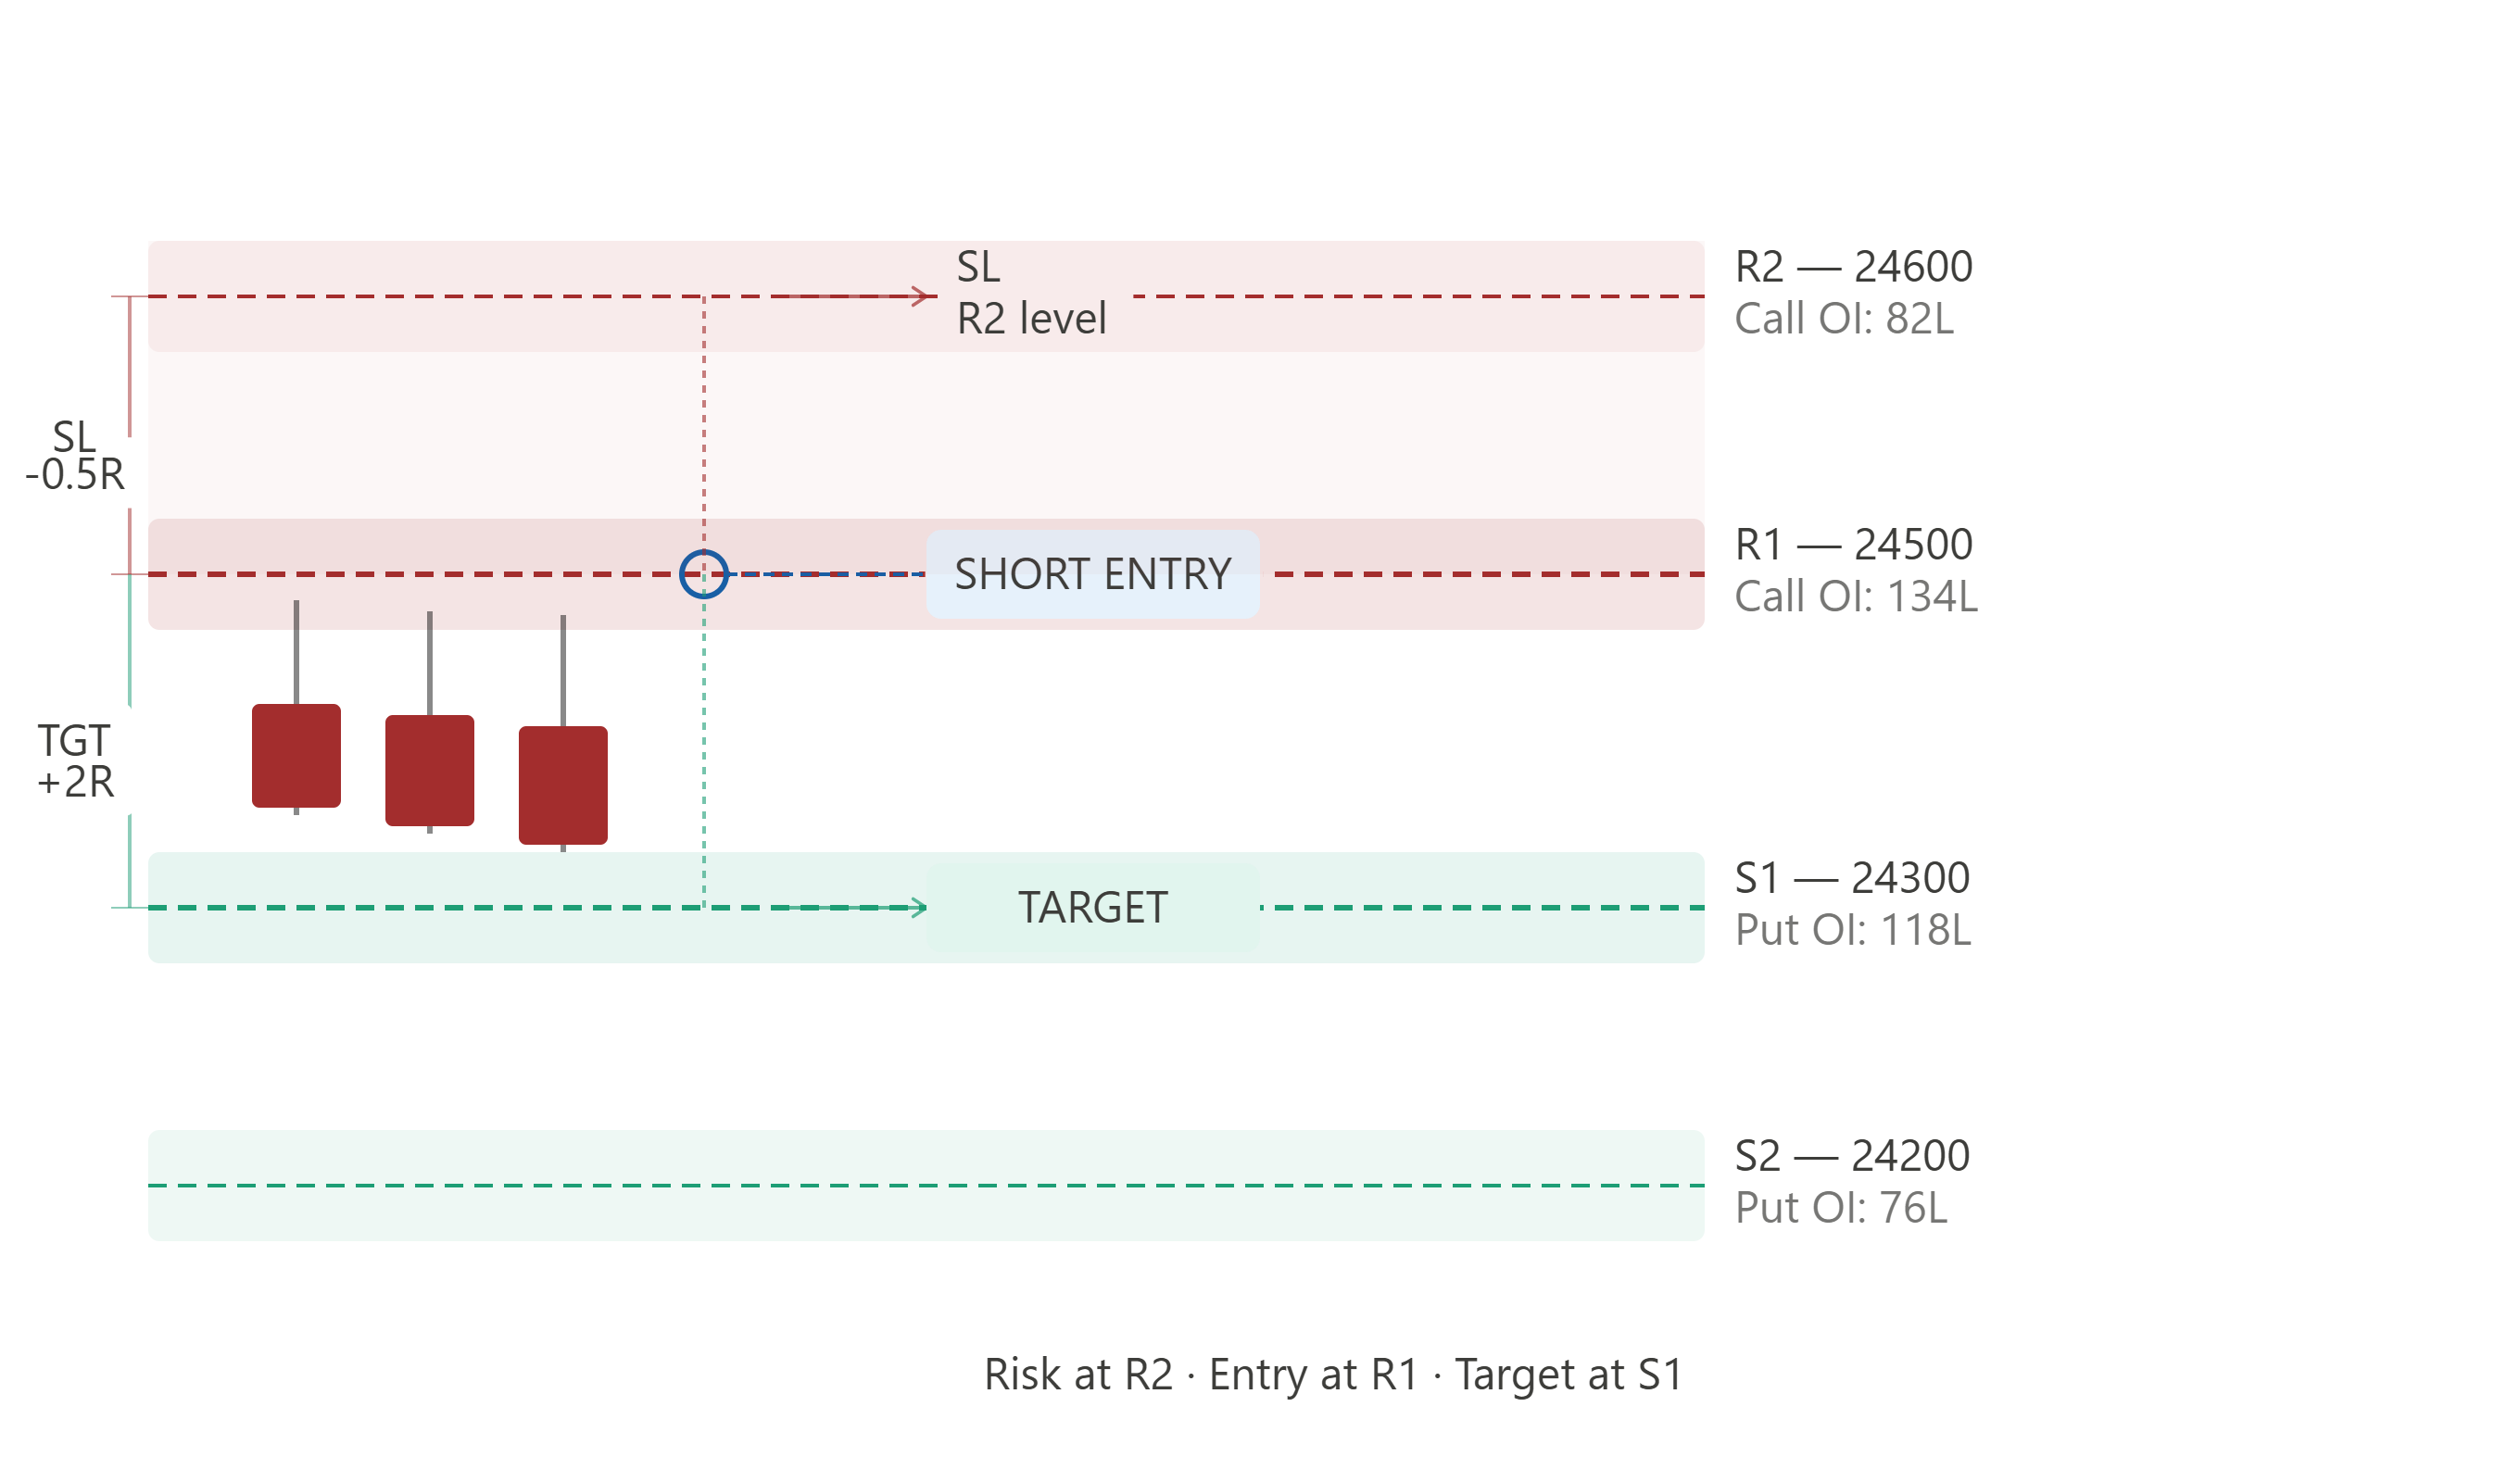
For example, if we take a short trade at a major resistance, we can keep the stop loss just beyond the next higher open interest level. For the target, we can aim toward the next one or two lower open interest zones.
This creates a predefined risk framework instead of random exits.
Why pivot points can mislead scalpers
-
Pivot points are common because they are easy to apply, but they can create levels that look important without showing whether anyone is actually defending them.
-
A pivot resistance might appear on the chart, yet there may be little to no meaningful call open interest there. In that case, the level can fail easily. A trader treating it as strong resistance may end up taking a poor setup.
-
Sometimes a pivot level and an open interest level line up well. When that happens, the confluence can be useful. But when they do not align, open interest often gives the better clue because it reflects actual option positioning.
-
That makes a big difference for scalping, where precision matters and hesitation at the wrong level can turn into a fast loss.
The golden rule for support and resistance based scalping
If we are trading support and resistance, especially for intraday scalping, open interest should be on the chart .
That does not mean we ignore price action. It means we combine both:
-
Use open interest to find the strongest possible levels.
-
Use chart behavior to confirm whether price respects those levels.
-
Trade only when risk is clearly defined.
This gives us a cleaner and more structured framework than using isolated technical levels alone.
How to automate the strategy with algo trading
Once the logic is clear, the next step is automation.
The process for building an algo around this idea is actually quite straightforward:
-
Log in through the trading API.
-
Fetch the option chain for the selected instrument.
-
Separate call strikes and put strikes.
-
Sort call strikes by open interest to find the top resistance levels.
-
Sort put strikes by open interest to find the top support levels.
-
Select the top three from each side.
-
Label them as support 1, support 2, support 3 and resistance 1, resistance 2,resistance 3
-
Use those levels as dynamic support and resistance zones for the strategy.
This approach effectively creates an open interest pivot point calculator . Instead of relying on fixed mathematical pivots, the algo identifies the most relevant support and resistance zones directly from market positioning.
That means the levels can update based on where actual options activity is concentrated.
What the algo is really doing
At its core, the algorithm is not trying to predict the market with magic. It is simply scanning the option chain and ranking strikes by importance.
For support:
-
Take all put strikes
-
Sort them by open interest
-
Pick the top three
For resistance:
-
Take all call strikes
-
Sort them by open interest
-
Pick the top three
That gives us an objective list of the most important nearby zones. Once those are plotted, we can use them manually or integrate them into an automated intraday scalping system.
How to use this idea responsibly
A strong framework does not mean we should jump into live trades immediately. The better approach is gradual:
-
Backtest the idea on historical charts and option chain data.
-
Paper trade it to understand how price behaves around major open interest levels.
-
Keep the indicator on the chart and observe how often those levels act as support or resistance.
-
Trade small only after confidence builds .
That process helps us learn how the setup behaves across different instruments and market conditions.
Where this strategy fits best
This setup is especially useful when:
-
We need fast intraday decision making
-
We want cleaner support and resistance levels
-
We prefer rule based entries and exits
-
We are building or testing algo trading strategies
-
We want a more market structure driven alternative to generic pivot levels
The core principle stays the same whether we apply it to stocks or broader derivative setups. The edge comes from identifying where large positions are concentrated and then waiting for price to reveal whether those participants are defending the zone.
Final takeaway
-
If scalping is all about speed and precision, then the quality of the level matters more than almost anything else. Open interest gives us a practical way to find those levels by tracking where meaningful options positioning exists.
-
Heavy call open interest can reveal strong resistance. Heavy put open interest can reveal strong support. When those levels also line up with clear chart behavior, the setup becomes far more actionable.
-
And if we want to go one step further, the whole process can be automated through algo trading by fetching option chain data, sorting strikes by open interest, and dynamically building support and resistance maps.
-
If we are serious about support and resistance based scalping, open interest should not be optional. It should be part of the core toolkit.
Made with Ultimate Scalping Strategy Using Algo Trading | Step by Step