As I’ve been browsing the web and following developments in fintech, I’ve noticed a fascinating trend where AI is being used for certain tasks in the financial sector—things like demat holding sectorial analysis, calculating ratios, screening for opportunities, and setting price alerts. While these are undoubtedly useful applications, I can’t help but feel that they’re somewhat shallow in comparison to what AI could potentially achieve, especially when it comes to derivative market analysis.
The idea really struck me when I uploaded a simple line chart with multiple data points, and AI provided a surprisingly insightful, subjective commentary on what those data points meant. It’s amazing how well AI can interpret this kind of data and turn it into something more digestible for human users.
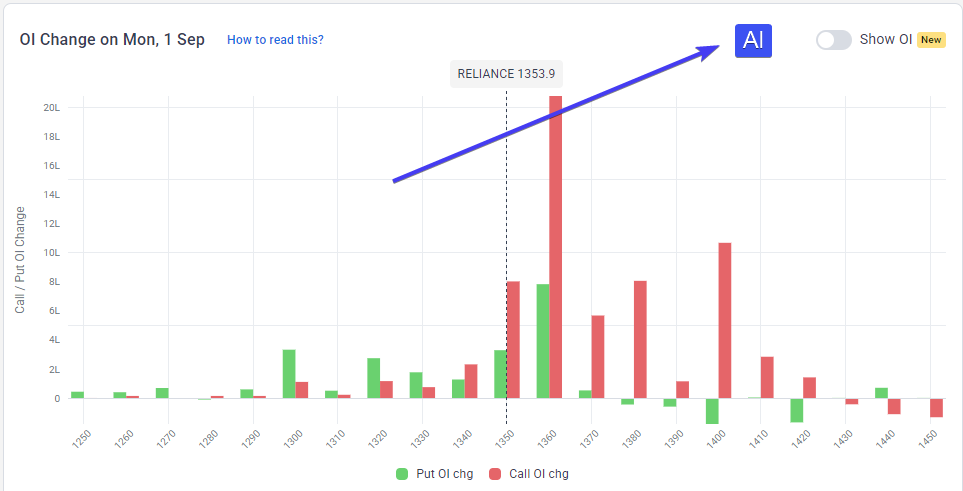
This made me wonder—why aren’t we applying similar technology to more complex derivative market charts, like Open Interest bar charts, Change in Open Interest, Implied Volatility (IV) charts, and Multi-Strike charts?
Here’s the concept I’m thinking about:
What if we had an icon next to these charts that allowed AI to automatically generate a subjective analysis of the current positioning of the data points? The key is that the AI wouldn’t even need raw data—imagine a simple screenshot of a bar chart being sent to the AI, which would then analyze it and send back a live analysis based on the data it sees. This could significantly improve the way traders and investors interpret complex charts, making these platforms far more user-friendly and intuitive.
I believe the true potential of AI in fintech is being underutilized right now.
The focus is mostly on the basics—price alerts, screening tools, and the like—but there’s so much more AI can do to provide deeper, more nuanced insights, especially in markets like derivatives.
This isn’t just a “nice to have” feature—it could fundamentally change the way we interact with financial data. We’re at a point where technology is capable of simplifying complex data, and fintech developers have a real opportunity to tap into this potential and bring it to the forefront of their platforms.
I’m encouraging fintech developers to take a closer look at this concept. The market for AI-driven analysis is growing, and I think it’s time we focus on unlocking deeper insights that go beyond the usual basics. Let’s not miss out on the true power of AI in our tools!