Fibonacci is one of the most commonly used concepts in technical analysis and is widely observed across stocks, indices, commodities, currencies, and even crypto markets.
The idea comes from the Fibonacci sequence, a mathematical pattern where each number is the sum of the previous two: 0, 1, 1, 2, 3, 5, 8, 13, 21…
From this sequence, certain ratios naturally emerge, such as: 23.6% , 38.2%, 50%, 61.8%, 78.6%
Among these, 61.8% is often referred to as the “golden ratio” and is one of the most closely watched levels in trading.
In markets, Fibonacci is commonly used to identify:
• Possible support and resistance zones
• Retracement levels during pullbacks
• Potential target areas during trends
• Areas where momentum may slow or reverse
One of the most popular tools is Fibonacci Retracement.
For example, If a stock moves from ₹100 to ₹200 and then starts correcting, traders may observe levels like: 38.2% retracement or 50% retracement or 61.8% retracement to understand where price may react or stabilise.
Another commonly used tool is Fibonacci Extension, which is often used to estimate possible target zones beyond previous highs or lows.
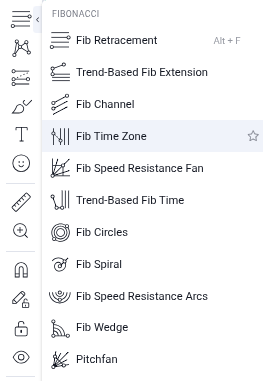
Over time, several indicators and tools have evolved around Fibonacci concepts, including below:
Many traders also combine Fibonacci with:
• Price action
• Trendlines
• Moving averages
• Volume analysis
• Support and resistance structures
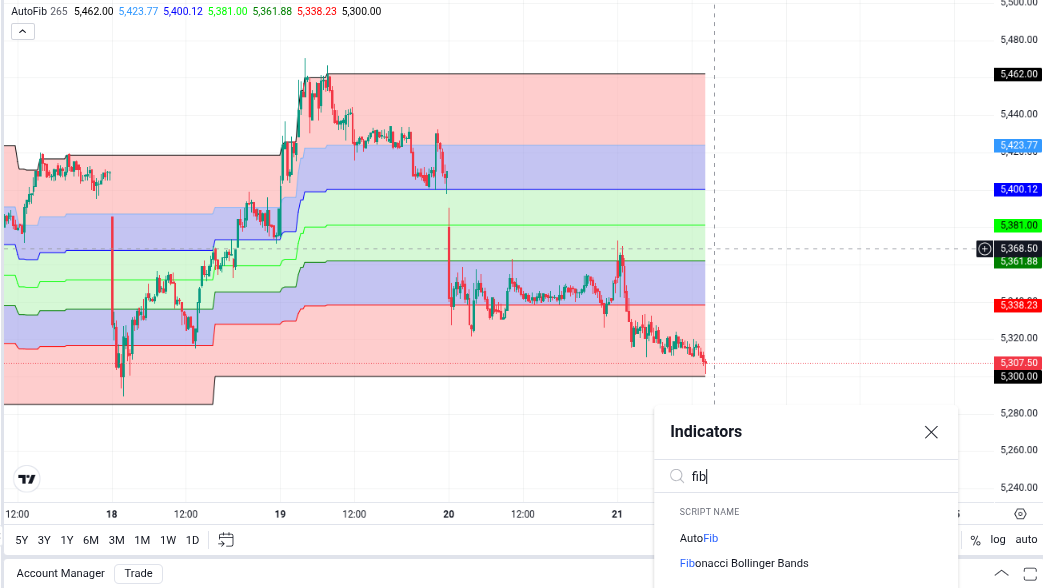
Some participants use Fibonacci as a standalone framework, while others use it as an additional layer of confirmation. we have developed AutoFib indicator which can be very helpful for new traders and also a Bollingerband based on Fibonacci Indicator availabe on Dhan charts.
One reason Fibonacci remains popular is because many market participants observe the same levels, which can sometimes influence market reactions around those zones.
Different traders may interpret Fibonacci differently depending on their strategy and timeframe.
Have Fibonacci levels or tools been part of your market analysis approach?