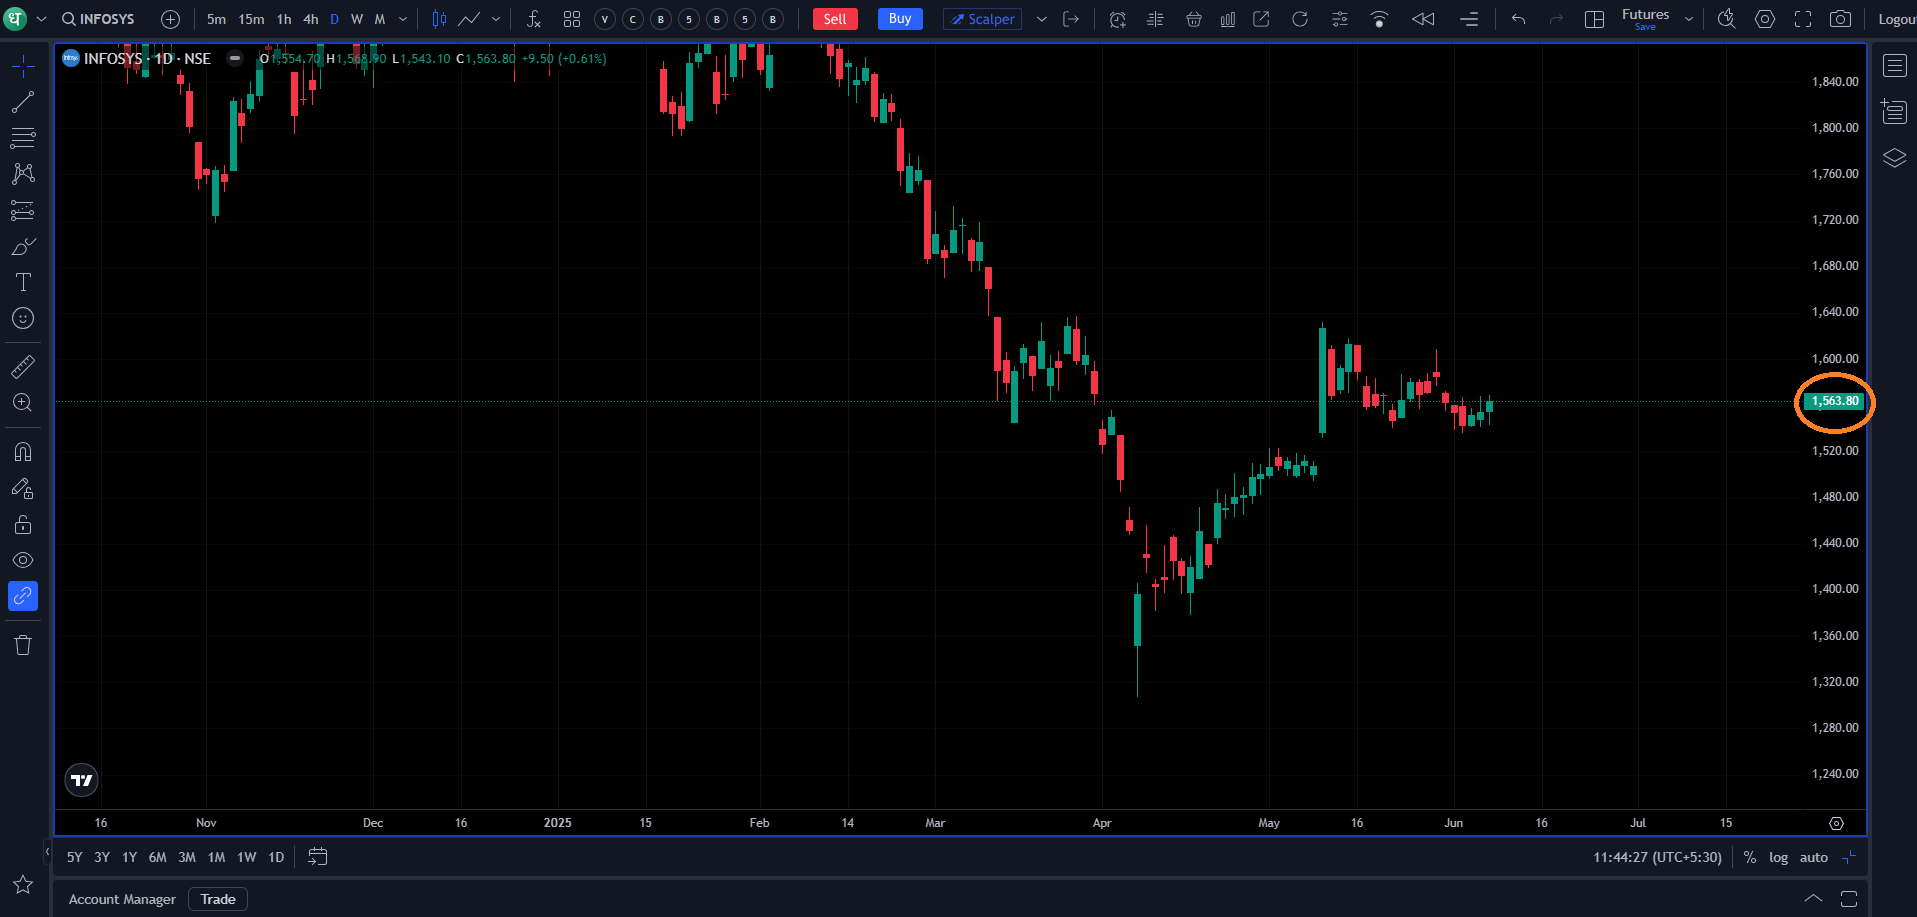
I am seeing two different closing price for the exact same stock on Dhan TV chart. I noticed that for all timeframes which are smaller than ‘1 day’, the closing price of the last candle is shown as 1567.60 and from the ‘1 day’ timeframe onwards, it is shown as 1563.80 (for the Infosys chart). I am attaching the screenshots for reference (taken on 8th June 2025).
for daily closing in India we have last half an hour average price taken as closing price … this is different to last 15 minutes happens rarely which happened here… it has own sets of interpretations for example:
3:05 PM → 5 shares at ₹1565
3:10 PM → 10 shares at ₹1570
3:20 PM → 4 shares at ₹1562
3:25 PM → 15 shares at ₹1568
The closing price would be: (5×1565)+(10×1570)+(4×1562)+(15×1568) / Total Shares Traded
HI @Akshay009, Thank you for sharing your observation.
The difference you’re seeing in the closing prices across timeframes is due to the way closing prices are recorded for different sessions:
On intraday timeframes (less than 1 day), the chart reflects the market close price at 3:30 PM.
On daily and higher timeframes, the chart shows the post-closing price recorded at 4:00 PM, which is the official closing price published by the exchange.
This is a standard practice followed across platforms to reflect the appropriate price based on the selected timeframe.