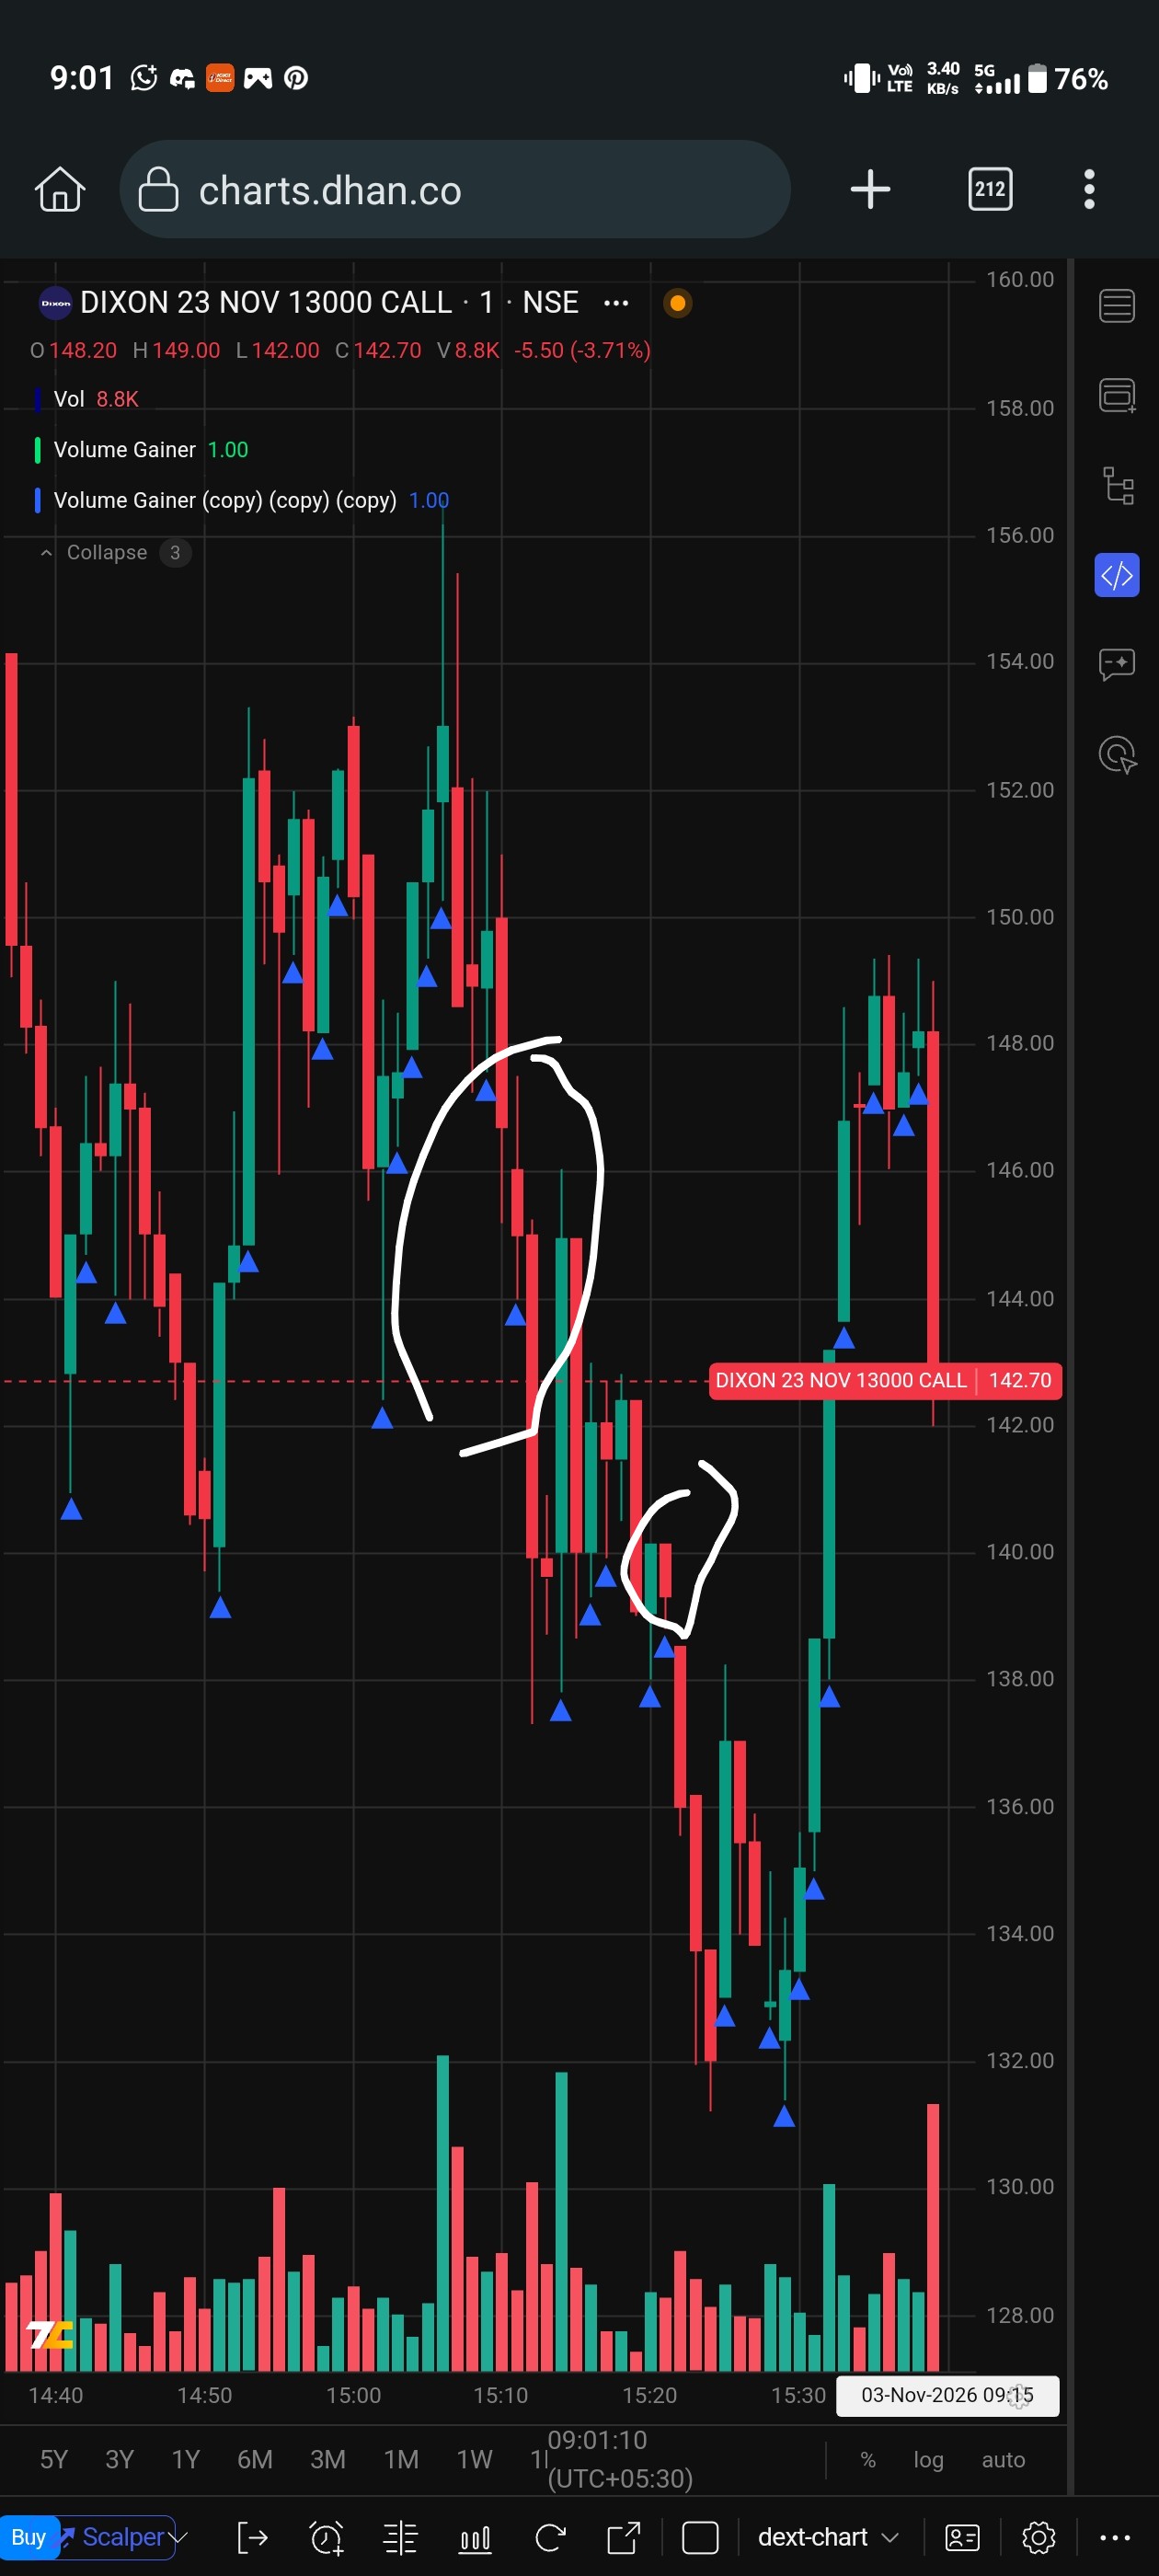
I created script to visualise green candles by
if close > open
volume_up = true
plotshape(volume_up, "Volume up", shape.triangleup, location.belowbar, color.lime, "Buy", size.large)
But it’s plotting on red candles also as you can see in screenshot
And also its not setting triangle location and color as mentioned in scripting i have to manually set it to my preference by setting gear