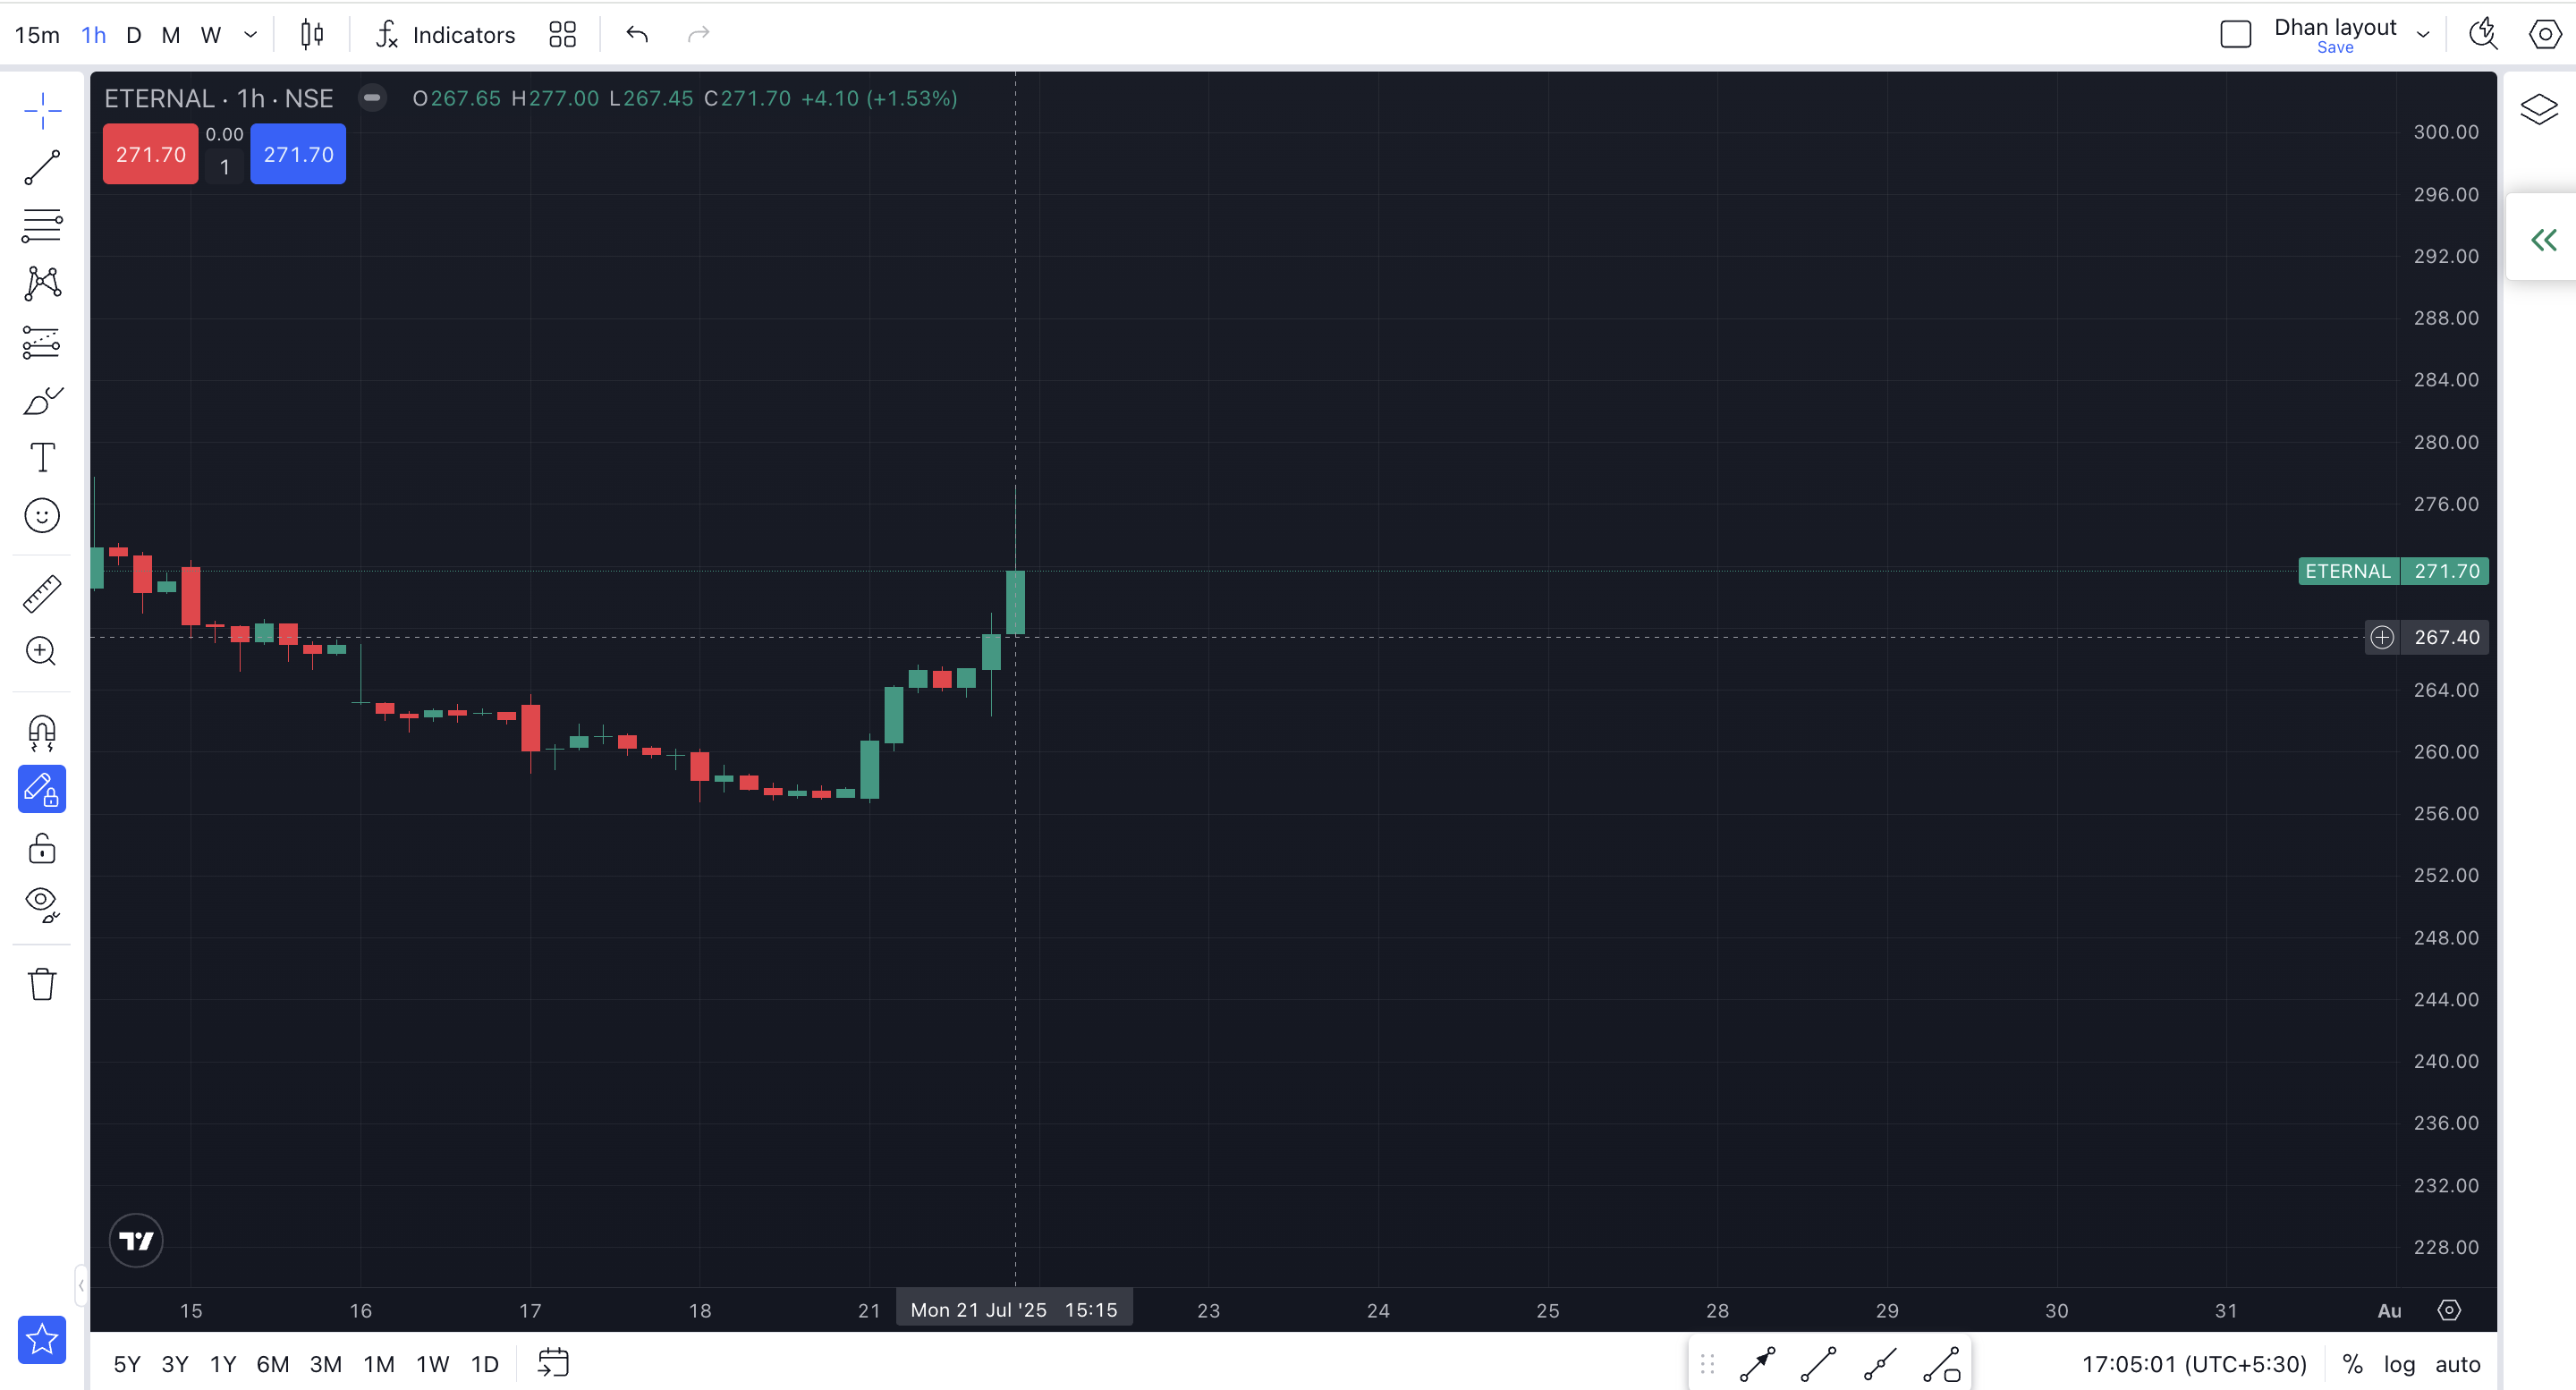
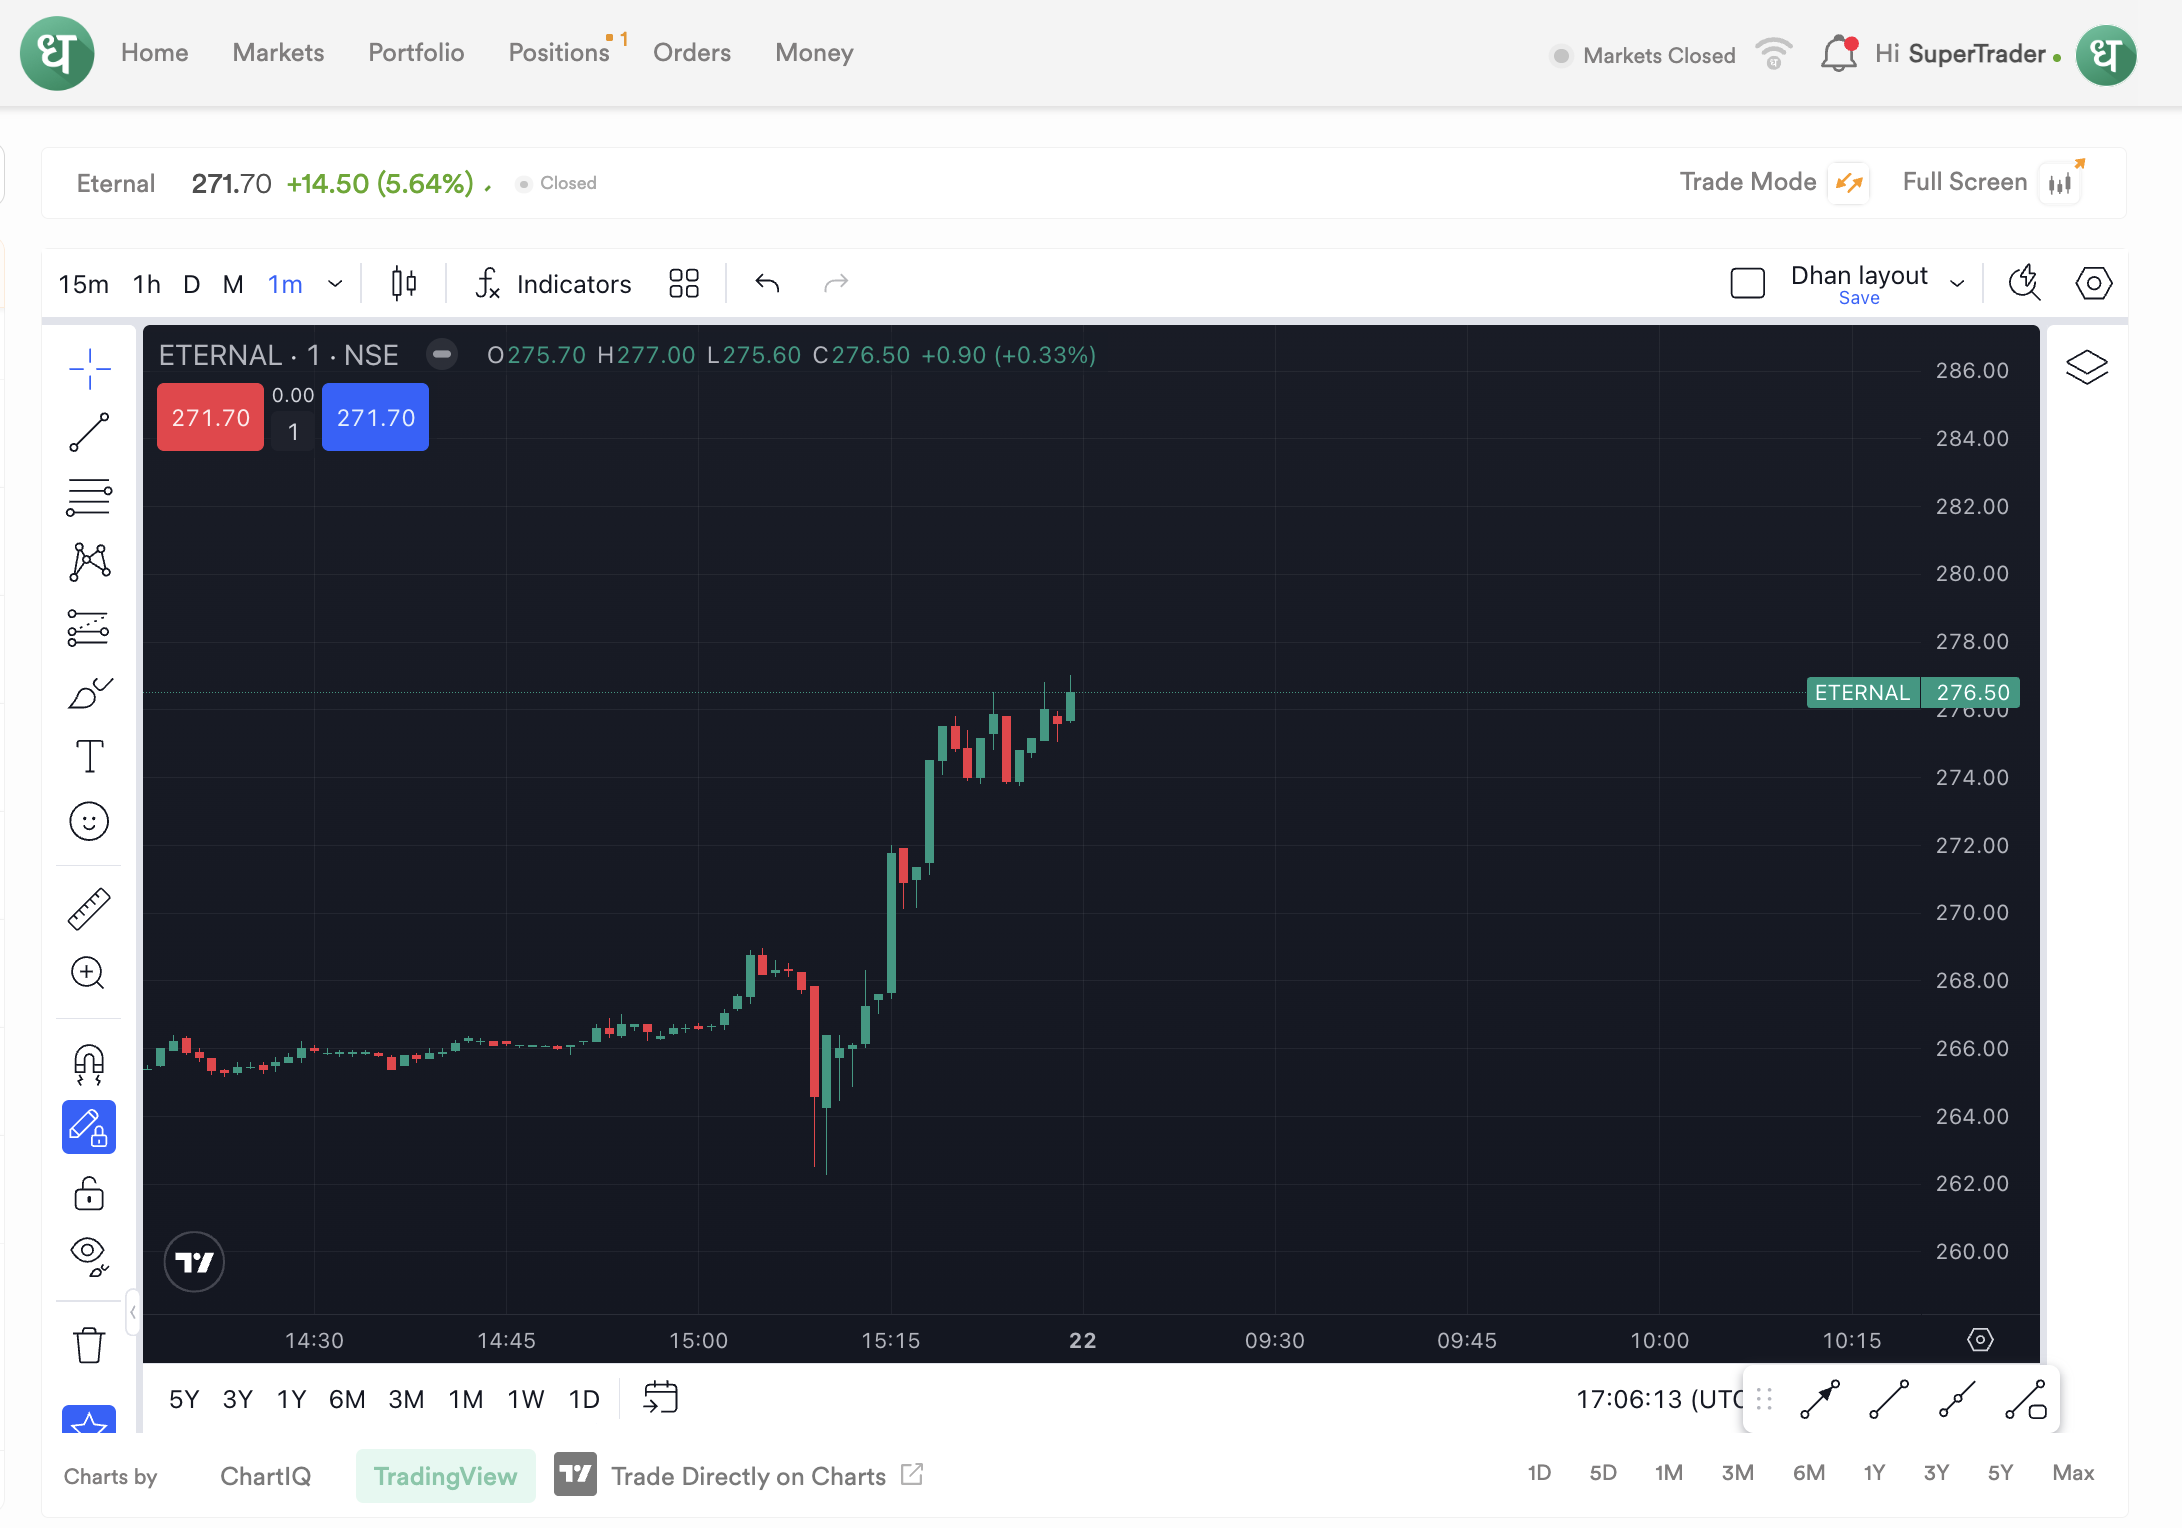
Zomato is up 5.8% today once its Q1’26 results came in. And here’s why-
Zomato’s Q1 FY26 results reveal a company in the midst of a strategic transformation. With consolidated revenue jumping 70% YoY to ₹7,167 crores, this isn’t just growth it’s systematic expansion across multiple verticals.
Revenue Breakdown & Growth Drivers
| Segment | Q1 FY26 | Q1 FY25 | YoY Growth | Revenue Share FY26 | Revenue Share FY25 |
|---|---|---|---|---|---|
| Quick Commerce | ₹2,400 cr | ₹942 cr | +155% | 33.5% | 22.4% |
| Food Delivery | ₹2,261 cr | ₹1,942 cr | +16% | 31.5% | 46.2% |
| Hyperpure B2B | ₹2,295 cr | ₹1,212 cr | +89% | 32.0% | 28.8% |
| Going Out | ₹207 cr | ₹95 cr | +118% | 2.9% | 2.3% |
| Others | ₹4 cr | ₹15 cr | -73% | 0.1% | 0.4% |
| Total Revenue | ₹7,167 cr | ₹4,206 cr | +70% | 100% | 100% |
Key Insights:
- Quick Commerce is the fastest-growing segment, nearly tripling its revenue share
- Food Delivery remains profitable but growing slower as the base matures
- Hyperpure B2B showing strong growth as supply chain scales
- Going Out doubling revenue, indicating early traction in entertainment vertical
The Profitability Paradox:
Here’s what’s fascinating: Zomato is profitable at the consolidated level (₹25 crores net profit) while simultaneously investing heavily in expansion. This is the hallmark of a mature platform business - using cash flows from established verticals to fund growth in emerging ones.
Segment Profitability Analysis:
| Segment | Q1 FY26 Result | Q1 FY25 Result | QoQ Change (vs Q4 FY25) | Margin % |
|---|---|---|---|---|
| Food Delivery | ₹465 cr profit | ₹321 cr profit | +₹26 cr | 20.6% |
| Quick Commerce | ₹(42) cr loss | ₹43 cr profit | +₹40 cr improvement | (1.8%) |
| Hyperpure B2B | ₹(5) cr loss | ₹(14) cr loss | +₹3 cr improvement | (0.2%) |
| Going Out | ₹(48) cr loss | ₹11 cr profit | ₹(4) cr decline | (23.2%) |
| Others | ₹(45) cr loss | ₹1 cr profit | ₹(29) cr decline | - |
Key Profitability Insights:
- Food Delivery continues as the profit engine with healthy 20%+ margins
- Quick Commerce losses narrowing significantly (₹82 cr loss in Q4 to ₹42 cr loss in Q1)
- Hyperpure approaching breakeven, showing operational leverage
- Going Out investments ramping up post acquisitions (OTPL & WEPL)
Strategic Moves Worth Noting
1. Blinkit Foods Limited Incorporation
The creation of a wholly-owned subsidiary specifically for food services isn’t just corporate restructuring—it’s preparing for vertical integration in quick commerce. This could enable:
- Direct food preparation and delivery
- Better margin control in high-frequency categories
- Reduced dependency on restaurant partners for certain offerings
Financial Health & Efficiency Metrics
Quarterly Performance Trends:
| Metric | Q1 FY26 | Q4 FY25 | Q1 FY25 | YoY Change | QoQ Change |
|---|---|---|---|---|---|
| Total Revenue | ₹7,167 cr | ₹5,833 cr | ₹4,206 cr | +70% | +23% |
| Net Profit | ₹25 cr | ₹39 cr | ₹253 cr | -90% | -36% |
| EBITDA | ₹469 cr | ₹440 cr | ₹413 cr | +14% | +7% |
| Employee Costs | ₹830 cr | ₹750 cr | ₹529 cr | +57% | +11% |
| Marketing Spend | ₹671 cr | ₹634 cr | ₹396 cr | +69% | +6% |
Key Efficiency Ratios:
| Ratio | Q1 FY26 | Q4 FY25 | Q1 FY25 | Trend |
|---|---|---|---|---|
| Employee Cost/Revenue | 11.6% | 12.9% | 12.6% | |
| Marketing/Revenue | 9.4% | 10.9% | 9.4% | |
| EBITDA Margin | 6.5% | 7.5% | 9.8% | |
| Net Margin | 0.3% | 0.7% | 6.0% |
Efficiency Analysis:
- Revenue scaling faster than operational costs, showing leverage
- Marketing efficiency improving as brand recognition grows
- Margin pressure expected during expansion phase across new verticals
The Bigger Picture: Platform Economics at Work
What’s happening here is textbook platform evolution:
Phase 1 (Historical): Build network effects in food delivery Phase 2 (Current): Leverage customer base and logistics for adjacent verticals Phase 3 (Future): Become the default commerce platform for urban India
Network Effects Compounding:
- Supply Side: Restaurant partners, delivery partners, warehouse networks
- Demand Side: 21+ million active users across verticals
- Data Layer: Purchase patterns, logistics optimization, demand forecasting
Investment Thesis: Why This Matters
Bull Case Arguments:
- TAM Expansion: From ₹4 trillion food delivery to ₹50+ trillion overall commerce
- Operating Leverage: Fixed costs spread across multiple revenue streams
- Competitive Moats: Network effects, data advantages, logistics infrastructure
- Management Execution: Consistent delivery on strategic pivots
Risk Factors:
- Competitive Intensity: Amazon, Flipkart, and others eyeing quick commerce
- Regulatory Challenges: GST issues (₹441 crores in disputes) indicate compliance complexity
- Unit Economics: Quick commerce still loss-making, path to profitability unclear
- Capital Requirements: Growth requires continued investment
Investment Risk-Reward Matrix
Valuation Metrics Comparison:
| Metric | Current | 1 Year Ago | Industry Average | Assessment |
|---|---|---|---|---|
| P/E Ratio | ~180x | ~45x | 25-35x | High Premium |
| Price/Sales | ~8x | ~12x | 3-5x | Reasonable |
| EV/Revenue | ~7.5x | ~11x | 4-6x | Fair |
| Price/Book | ~6x | ~8x | 2-4x | Premium |
Risk Assessment Framework:
| Risk Factor | Impact | Probability | Mitigation | Score (1-10) |
|---|---|---|---|---|
| Competitive Pressure | High | High | Network effects, scale | 8 |
| Regulatory Changes | Medium | Medium | Compliance focus | 6 |
| Unit Economics | High | Medium | Operational leverage | 7 |
| Capital Requirements | Medium | Low | Strong cash generation | 5 |
| Market Saturation | Medium | Low | TAM expansion | 4 |
Bull vs Bear Case Scenarios:
| Scenario | Revenue (FY27E) | Net Margin | Key Assumptions |
|---|---|---|---|
| Bull Case | ₹45,000 cr | 8-10% | Market leadership, successful expansion |
| Base Case | ₹32,000 cr | 4-6% | Steady growth, competitive market |
| Bear Case | ₹24,000 cr | 1-3% | Intense competition, margin pressure |
Key Metrics to Watch Going Forward:
Quarterly Tracking Dashboard:
| Metric Category | Key Indicators | Target Range |
|---|---|---|
| Growth | Revenue YoY, Segment growth | 25-40% |
| Profitability | EBITDA margin, Segment profits | 6-12% |
| Efficiency | Cost/Revenue ratios, AOV trends | Improving |
| Market Share | Orders, Cities, User base | Maintain leadership |
| Unit Economics | Contribution margins, CAC/LTV | Positive trends |
Competitive Positioning & Market Share Analysis
Platform Metrics Comparison (Estimated Industry Data):
| Metric | Zomato | Swiggy | Amazon (Quick Commerce) | Competitive Advantage |
|---|---|---|---|---|
| Food Delivery Market Share | ~50-55% | ~45-50% | - | Market leader |
| Quick Commerce Cities | 300+ | 400+ | 50+ | Rapid expansion |
| Average Order Value (Food) | ~₹400 | ~₹350 | - | Premium positioning |
| Delivery Time (Quick Commerce) | 10-15 min | 10-15 min | 15-30 min | Operational parity |
Annual Performance Comparison:
| Metric | FY25 | FY24 | FY23 | CAGR (FY23-25) |
|---|---|---|---|---|
| Total Revenue | ₹20,243 cr | ₹12,114 cr | ₹8,416 cr | 55% |
| Food Delivery Revenue | ₹8,080 cr | ₹5,918 cr | ₹4,923 cr | 28% |
| Quick Commerce Revenue | ₹5,206 cr | ₹1,901 cr | ₹442 cr | 252% |
| Net Profit | ₹527 cr | ₹351 cr | ₹(971) cr | - |
| Active Users (est.) | 21M+ | 18M+ | 15M+ | 18% |
Market Position Insights:
- Dominant in food delivery, neck-and-neck with Swiggy
- Quick commerce growth trajectory ahead of competitors
- Successfully monetizing user base across multiple verticals
Conclusion
Zomato is executing a sophisticated strategy: using profits from food delivery to build multiple commerce verticals, leveraging shared infrastructure and customer relationships. The Q1 results show this strategy working—the company is growing rapidly while remaining profitable.
For investors, this represents both opportunity and complexity. The successful execution of this multi-vertical strategy could create a commerce giant. The risk lies in competitive pressures and the capital-intensive nature of the expansion.
The next 8-12 quarters will be critical in determining whether Zomato becomes India’s Amazon or remains primarily a food delivery company with additional services. Based on current execution, the former seems increasingly likely.
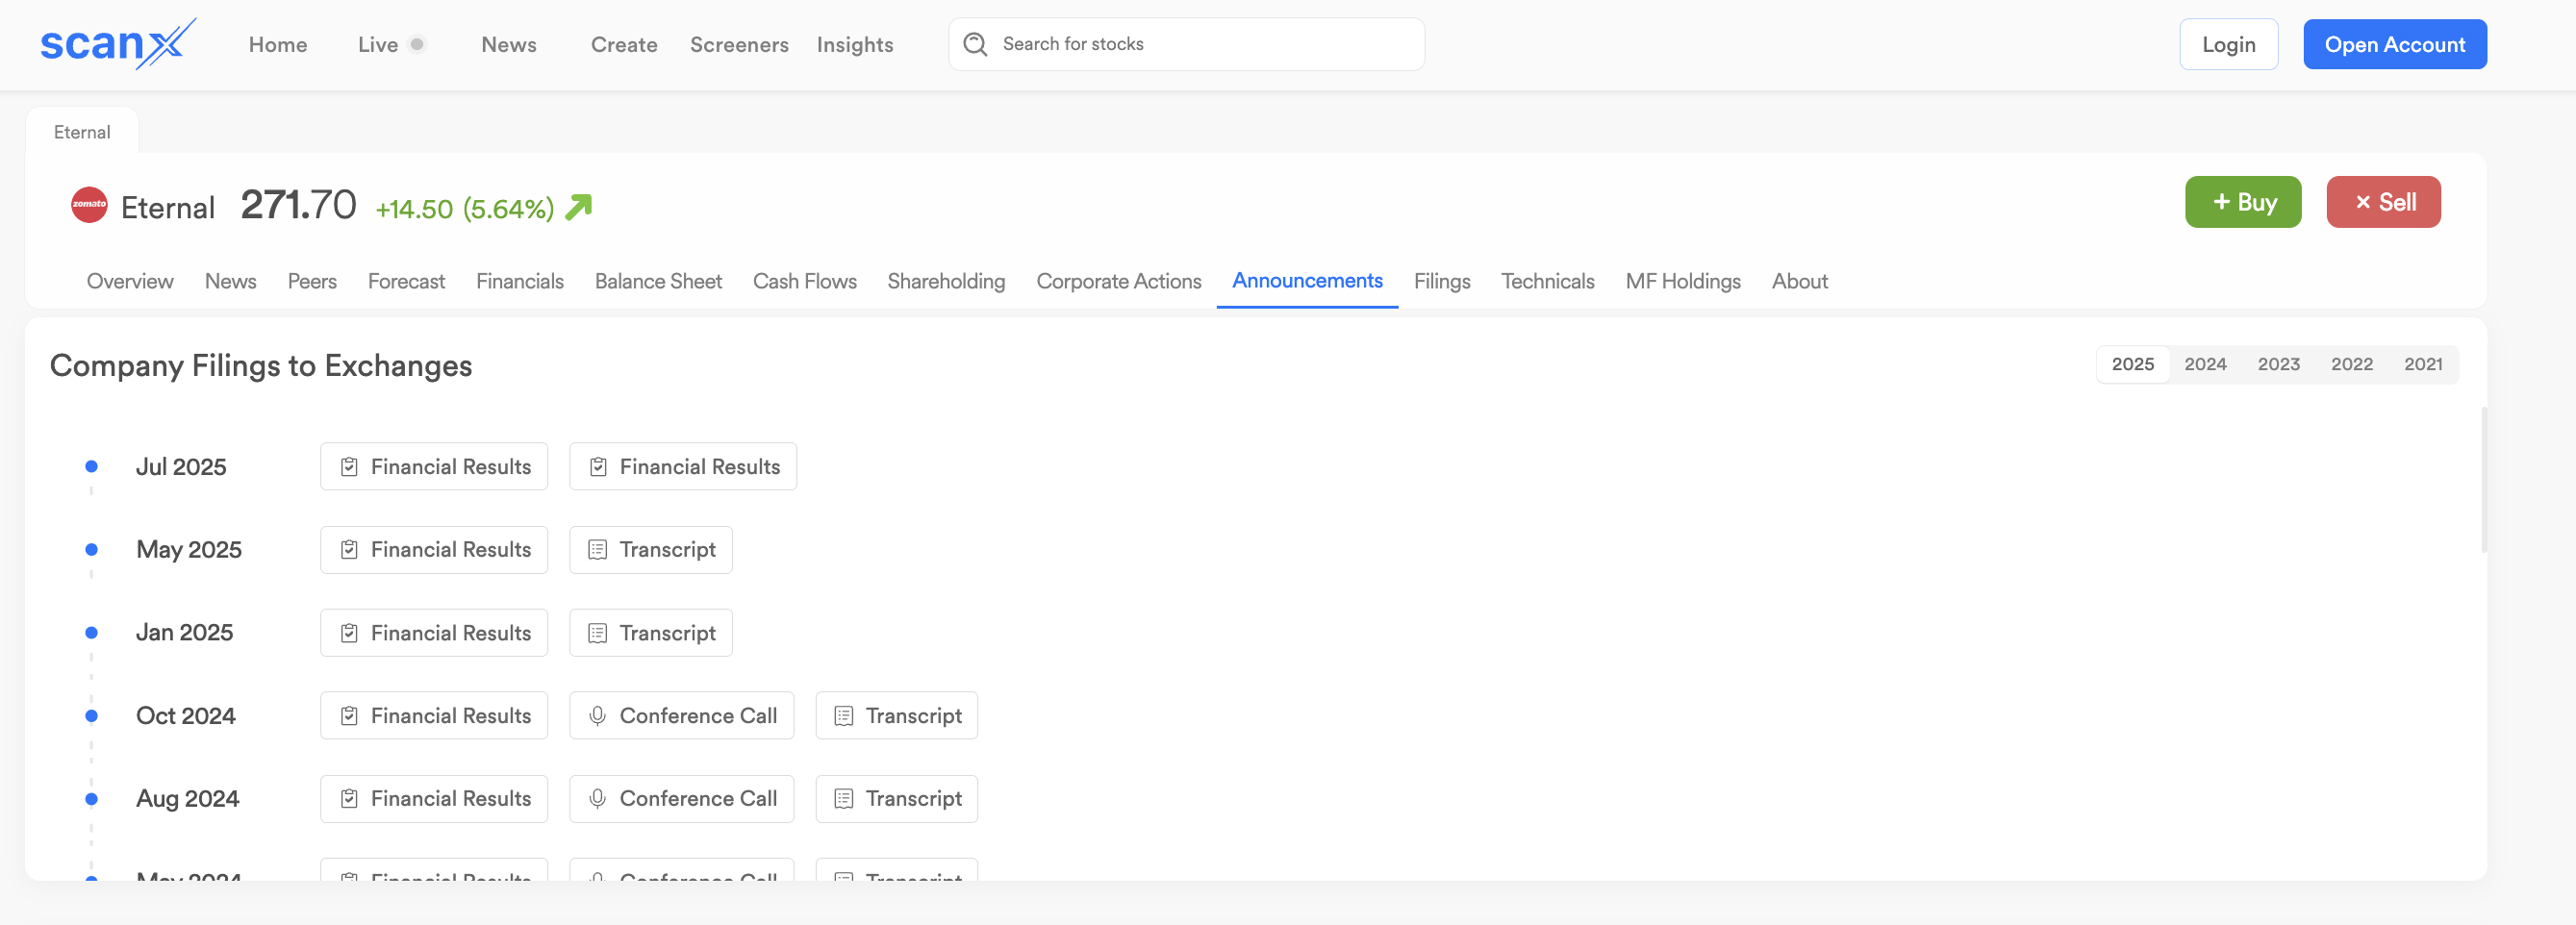
The filings for Eternal are now live on Scanx.Trade, Check it here: