Hello Traders,
At Dhan, we understand that traders need to stay informed, analyse markets in-depth, build strategies, and react to changing market conditions in real time. That’s exactly why we built Options Trader and over time we have continued to enhance Options Trader across both app and web.
We have made multiple improvements with every update bringing in features such as the Advanced Option Chain, OI/OI Change Graphs, Straddle Chart, Options Buildup data and and several other insights. Each feature is built with a single objective: to help traders understand the market better, reduce guesswork, and make informed decisions.
As options trading has evolved, volatility analysis has become an important decision-making factor, but, while price charts and option chains are easily accessible, getting meaningful volatility insights such as if the current volatility is relatively high, whether premiums are overpriced or underpriced, and how IV has changed over time isn’t straightforward.
Traders often have to switch between multiple platforms, compare data manually, and rely on expensive tools to answer these questions. This challenge is what led us to build a suite of volatility-focused analysis tools.
Introducing: Advanced Volatility Analysis on Options Trader Web
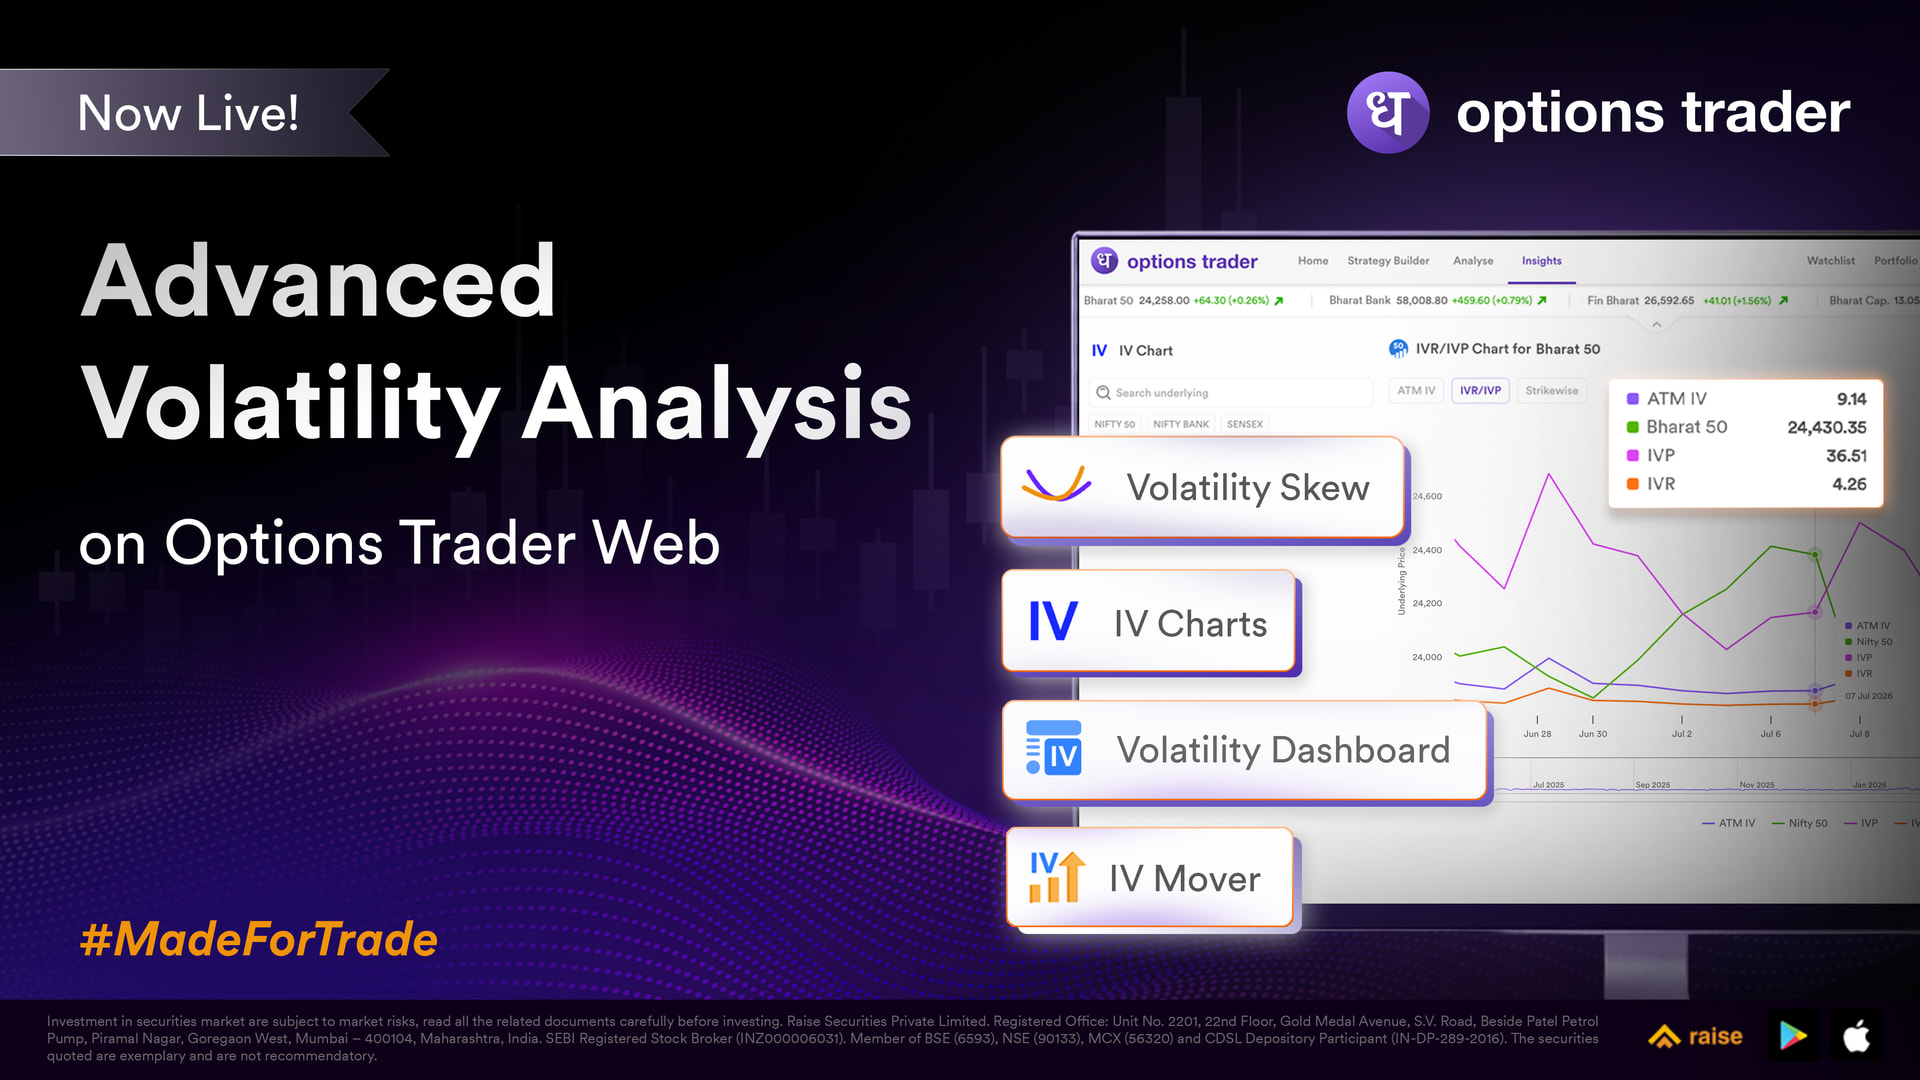
We have brought in-depth volatility analysis into one unified section, directly on your big screen. No switching platforms, no manual correlation of data. A complete, real-time picture of market movement, so you can understand the market and act on it with the following tools:
Volatility Dashboard and Multi-Index IV: See the current India VIX value alongside a live VIX chart with timeframe toggles (1D, 5D, 1M, 6M, 1Y and 5Y). Compare rolling ATM IV for the last 30 days across Nifty 50, Sensex, Bank Nifty, Midcap Nifty, Bankex and FinNifty with a time interval of your choice (1min, 5min, 15min, 30min, or 60min) on a single multi-line chart with auto data updates.
IV Skew: Check IV plotted across strikes for the selected expiry, with IV calculated and marked on the chart for each strike. Get the option of overlaying IV skew curves for multiple expiries simultaneously and we also give you the ability to select strike range presets (All, 40, 30, 20, 10) to focus on the strikes that matter.
SD Zones: See 1, 2, and 3 standard deviation price ranges for all instruments, calculated from spot price. The visual shows the current spot at centre with SD-based support and resistance zones along with key metrics like ATM IV, Vega, IVP, Max Pain and PCR displayed below.
ATM IV Chart: The ATM IV Chart gives you a real-time, continuous view of implied volatility at the ATM strike, overlaid with the underlying spot price, so you can see how volatility is behaving relative to price action without any manual tracking along multiple timeframes (1m, 5m, 15m, 30m, and 60m).
IVR and IVP Chart: You can check IV Rank and IV Percentile plotted over time alongside ATM IV on a day-wise chart, telling you where the current IV stands relative to the custom lookback periods - 1 Week, 1 Month, 3 Month, 6 Month or 1 Year.
Individual Strikes IV Chart: An intraday view showing IV lines for multiple selected strikes alongside the Nifty spot price. Pick your expiry and select multiple strikes at once.
IV Movers: A full IV screener listing all F&O stocks allowing you to sort by highest or lowest IV, IVP, and IVR to quickly find trading candidates. Also, choose your lookback period - 1 Week, 1 Month, 3 Month, 6 Month or 1 Year from the dropdown.
Volatility Analysis is a pure analytics layer that gives you the data, context, and visual tools to form your own volatility-informed view.
Volatility Analysis is now live on Options Trader Web. Navigate to the Insights tab and select from the volatility analysis available. Log in at options-trader.dhan.co to get started now.
Do let us know how it is helping you in your daily trading and what more we can add to improve your volatility analysis workflow.
Happy Trading,
Jai