Hello Traders & Investors
As you all are aware, since 3 August 2026, the closing price of F&O stocks is no longer a VWAP average, it is discovered through the Closing Auction Session (CAS), where all buy and sell interest pools together and match at a single equilibrium price. We covered the full mechanics of CAS in an earlier post here, and if you haven’t read it yet, that is the place to start.
This post is about something different: how you can now actually watch that price discovery happen, live, across the whole market.
Presenting the CAS Dashboard, now live on Dhan Web.
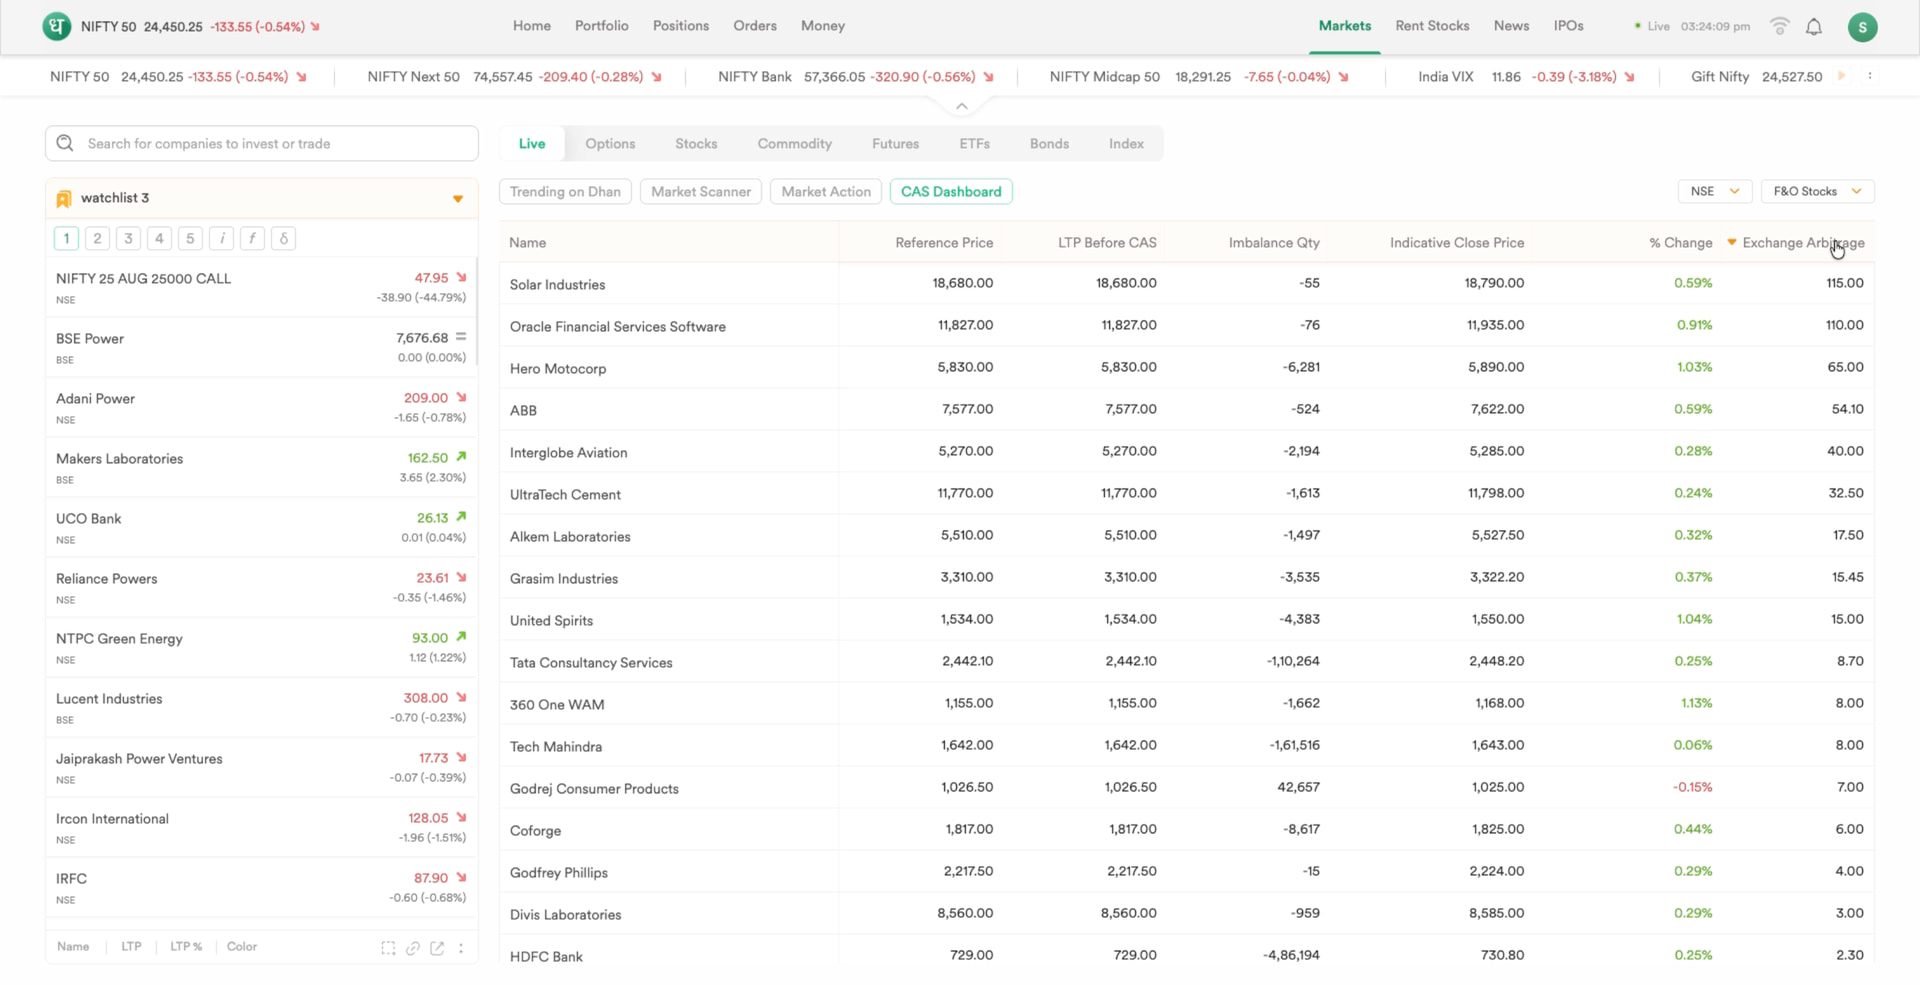
Between 3:20 PM and the random close, the Indicative Equilibrium Price (IEP) of every CAS-eligible stock is updated in real time. That is genuinely useful information, it tells you where the market is currently agreeing to close, and how that view is shifting as orders come in.
The problem is that until now you could only see one stock at a time.When CAS starts, the LTP field becomes the Indicative Close Price. If you wanted a market-wide picture of how the close was forming, you were either flipping between scrips or waiting for exchange-level data after the fact.
The CAS Dashboard puts all of it on a single screen.The dashboard lists every CAS-eligible stock in one live table that updates through the session. Here is each column and what it is telling you.
-
Reference Price : The VWAP of the stock’s trades between 3:00 PM and 3:15 PM. This is the anchor for the entire auction. It sets the ±3% price band, and it becomes the close if no equilibrium price can be discovered. Worth remembering that the reference price is the starting point, not the result.
-
LTP Before CAS : The last traded price before the Continuous Trading Session ends and the auction takes over. This is your “before” snapshot, and it is the single most useful anchor on the screen. Every big last-minute candle you see on a chart is the gap between this number and where the auction actually settles, so watching the two side by side is how you know a closing candle is forming before it prints.
-
Imbalance Qty : The unmatched buy or sell quantity currently sitting in the auction. Imbalance matters for two reasons.It tells you there is one-sided pressure that has not yet found a counterparty.
-
Indicative Close Price : The IEP or Indicative Equilibrium Price as it stands right now, based on orders collected so far. This is the number to watch, and the point is to watch it move, not read it once.
-
% Change from LTP Before CAS : The move in the Indicative Close Price against the 3:15 PM price, in percentage terms. Sort by this and you have the day’s biggest CAS movers instantly.
-
Exchange Arbitrage : The difference in indicative close price for the same stock across NSE and BSE, wherever applicable. Gaps here are worth a second look, particularly where liquidity is uneven between the two.
Think of the CAS Dashboard as a live market scanner for the closing auction. A few ways to read it:
- Sort by % Change to surface stocks where the auction is pricing meaningfully away from where the market was minutes earlier.
- Read Imbalance Qty alongside the Indicative Close Price. Heavy imbalance with a stable ICP behaves very differently from heavy imbalance with a drifting one.
- Scan Exchange Arbitrage to spot where NSE and BSE are disagreeing on the close.
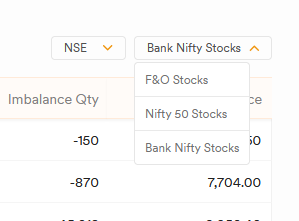
- Use the index filters to see how the auction is shaping index levels, not just individual names.
One thing to keep in mind: the session closes randomly between 3:28 and 3:30 PM, and matching only happens from 3:30 PM. Until then the IEP is exactly what its name says, indicative. Treat it as a guide, not a guaranteed close.
This is live on Dhan Web for now. Open Markets → Live → CAS Dashboard on Dhan Web and keep it running through the close today. The session is short and it moves, you will get a feel for it quickly. Then come back here and tell us what you want next. This is version one, and we would much rather build version two around what you actually use.
Drop your thoughts in the thread below.
Naman