Dear Investors & Traders,
Markets move in cycles. This is one of those things that every trader and investor knows at
some level, almost instinctively.
You have probably noticed that certain months tend to feel heavier than others, or that a
particular stock seems to do something predictable around the results season. But noticing a
pattern in your head and actually being able to see it clearly, backed by a decade of data,
laid out in front of you without any effort on your part, are two very different things.
For a long time, acting on cyclical intuition meant doing a lot of work yourself. You would pull
historical data, build a spreadsheet, try to line up years side by side, and hope you had not
missed anything. Most people simply did not bother, not because the insight was not
valuable, but because the effort to get there was not worth it. We have been thinking about
this problem for a while, and today we are ready to share what we built for you.
Introducing Cyclical Trend, now live under Market Insights on ScanX
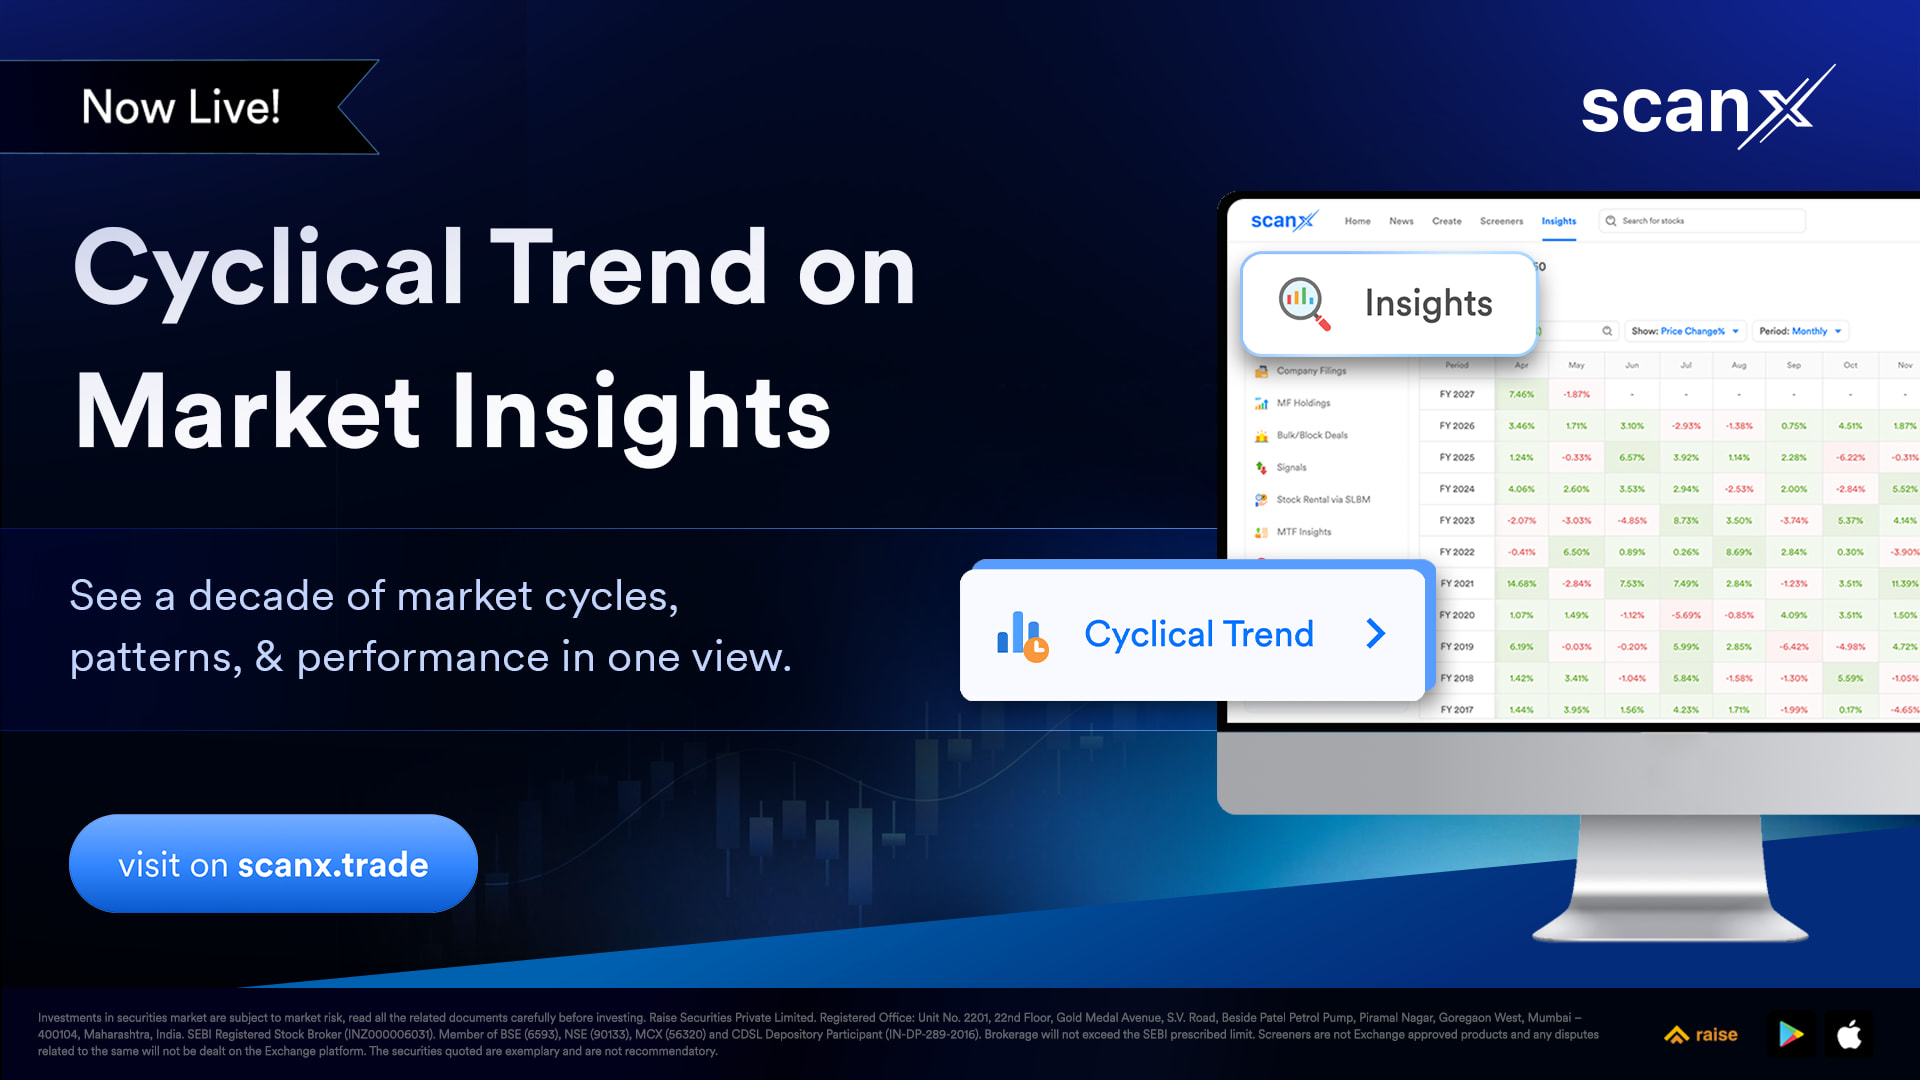
The feature does something that sounds straightforward but takes real thought to get right. It
lets you see how any index or stock has performed across every single month and quarter,
going back over a decade, all in one clean view. Financial year or calendar year, monthly or
quarterly, the choice is yours. The data is right there, colour-coded so that the strong months
and the weak months reveal themselves immediately without you having to do any reading
between the lines.
On the Indices side, you can bring up any major index and look at price change percentages
laid out across years. But you can also go beyond price.
Toggle to PE Ratio, PB Ratio, or Dividend Yield and you start to see valuation cycles that
pure price data would never show you. Understanding whether an index tends to get
expensive or cheap at a particular point in the year is a different kind of edge, and it is now
just a click away.
On the Stocks side, the picture gets even richer. For any stock, you can track EPS, ROE,
ROCE, EBITDA, Market Cap, and Public Holding quarter by quarter across years, right
alongside price change. If you have ever been curious about how a company’s earnings
have historically behaved in Q1 versus Q3, or whether a stock’s institutional holding tends to
shift at a certain point in the year, this is exactly where you go to find out. The quarterly EPS
view alone tells a story that annual numbers simply cannot.
What we love about this feature is that it respects how traders and investors actually think.
You are not being handed a signal or a recommendation. You are being given a richer
historical context, a way to see the flow of the market or a company over time, so that
whatever decision you are making, you are making it with more behind you. Cyclical Trend
does not replace your judgement. It gives your judgement more to work with.
This is part of something larger we are building at ScanX. The goal has always been to bring
the kind of analytical depth that was once only available to institutional desks within reach of
every trader and investor in India, without requiring them to have a Bloomberg terminal or a
data science background. Cyclical Trend is a step in that direction, and there is significantly
more in the pipeline.
It is live right now in the Insights section of ScanX.
Go explore it, pick an index or a stock you follow closely, and see what the last ten years
have to say. We would genuinely love to hear what patterns you discover and what you think
of the experience.
Kind Regards,
Kushagra
Disclaimer :- Advertisement Disclaimer & Information | Dhan