Hello Traders! 
Two requests kept coming back more than anything else over the last few weeks. One was about multi-monitor support - traders running two, sometimes three monitors, still stuck working inside a single DEXT T3 window because nothing could move outside it. The other was about charts - traders already running tv.dhan alongside DEXT T3, asking why the two didn’t talk to each other, why a setup built on one never carried over to the other.
We heard both, and worked on them. But June wasn’t just about closing out repeat asks - we also shipped a few things we’re genuinely excited about. Here’s a detailed look at everything that went out on DEXT T3 this month.
Floating Widgets: Pop-out & Multi-Screen Trading
We heard you - Floating Widgets are here now: any widget or panel can pop out of the terminal into its own floating window. Look for the pop-out icon on a supported widget, click it, and it breaks free - drag it to your second monitor, resize it, and place it wherever you actually work best. Chart on one screen, Order Flow on another, Watchlist off to the side - all live at once, all part of the same terminal. Symbol colour sync keeps working across floating widgets just like it does inside the main window, and a refresh doesn’t undo your setup. Close a widget and it docks right back into the main panel; come back later, and everything’s sitting exactly where you left it, coordinates and all.
Once your screens are spread out, moving through them needs to stay quick, so a few things came with it. CMD/CTRL + Left/Right jumps you to the previous or next widget, and CMD/CTRL + Shift + Left/Right moves you a full widget panel over.
We also gave key actions their own shortcuts, since half the fight in scalping is not breaking your rhythm to reach for the mouse:
-
Alt + A - Set Alert Order
-
Shift + P - Power Scalper
-
Alt + F - Floating Scalper
-
Shift + O - Order Flow
-
Shift + S - Option Scalper
-
Alt + R - RCG
The Shortcuts widget got a redesign too, so it can keep growing without turning into a mess.
Chart Sync: tv.dhan to DEXT T3
Here’s exactly how it works. Turn on the sync setting, and tv.dhan charts start showing up inside DEXT T3 - hit refresh, and whatever’s built on tv.dhan pulls straight into your DEXT T3 setup. From there, changes stay in sync across both platforms, indicator templates included. There are two ways this can work, and they’re either/or, not both together. Turn on Sync with tv.dhan, and after a mandatory refresh, your tv.dhan layouts pull into DEXT T3 - from there, changes on either side, including new layouts you create, stay synced both ways. With this on, Sync Across Layout isn’t something you can toggle separately. Leave Sync with tv.dhan off, and you can turn on Sync Across Layout instead - this works purely within DEXT T3, propagating a layout you build across your own DEXT T3 predefined and custom layouts, with tv.dhan not involved at all. In effect, you end up with two independent layout types: DEXT T3-native layouts that sync only among themselves, and tv.dhan-origin layouts that sync directly with tv.dhan.
Strategy Builder: Now with Market Outlook Strategies & Risk Map
If you last looked at Strategy Builder when we introduced it with P&L Breakdown, it’s worth a second look - it’s grown since. Quick recap: build any strategy from scratch or load a pre-built one, watch a live payoff graph with Expiry, Today, and Target lines, layer Call/Put OI bars right over that payoff, adjust IV to stress-test before you deploy, see Overall Margin, Final Margin, Hedge Benefit, and Net Premium upfront, save up to 5 strategy snaps, and fire every leg together in one click. P&L Breakdown then tells you exactly what’s behind your number - how much came from the move in spot, how much from time decay, how much from a shift in volatility.
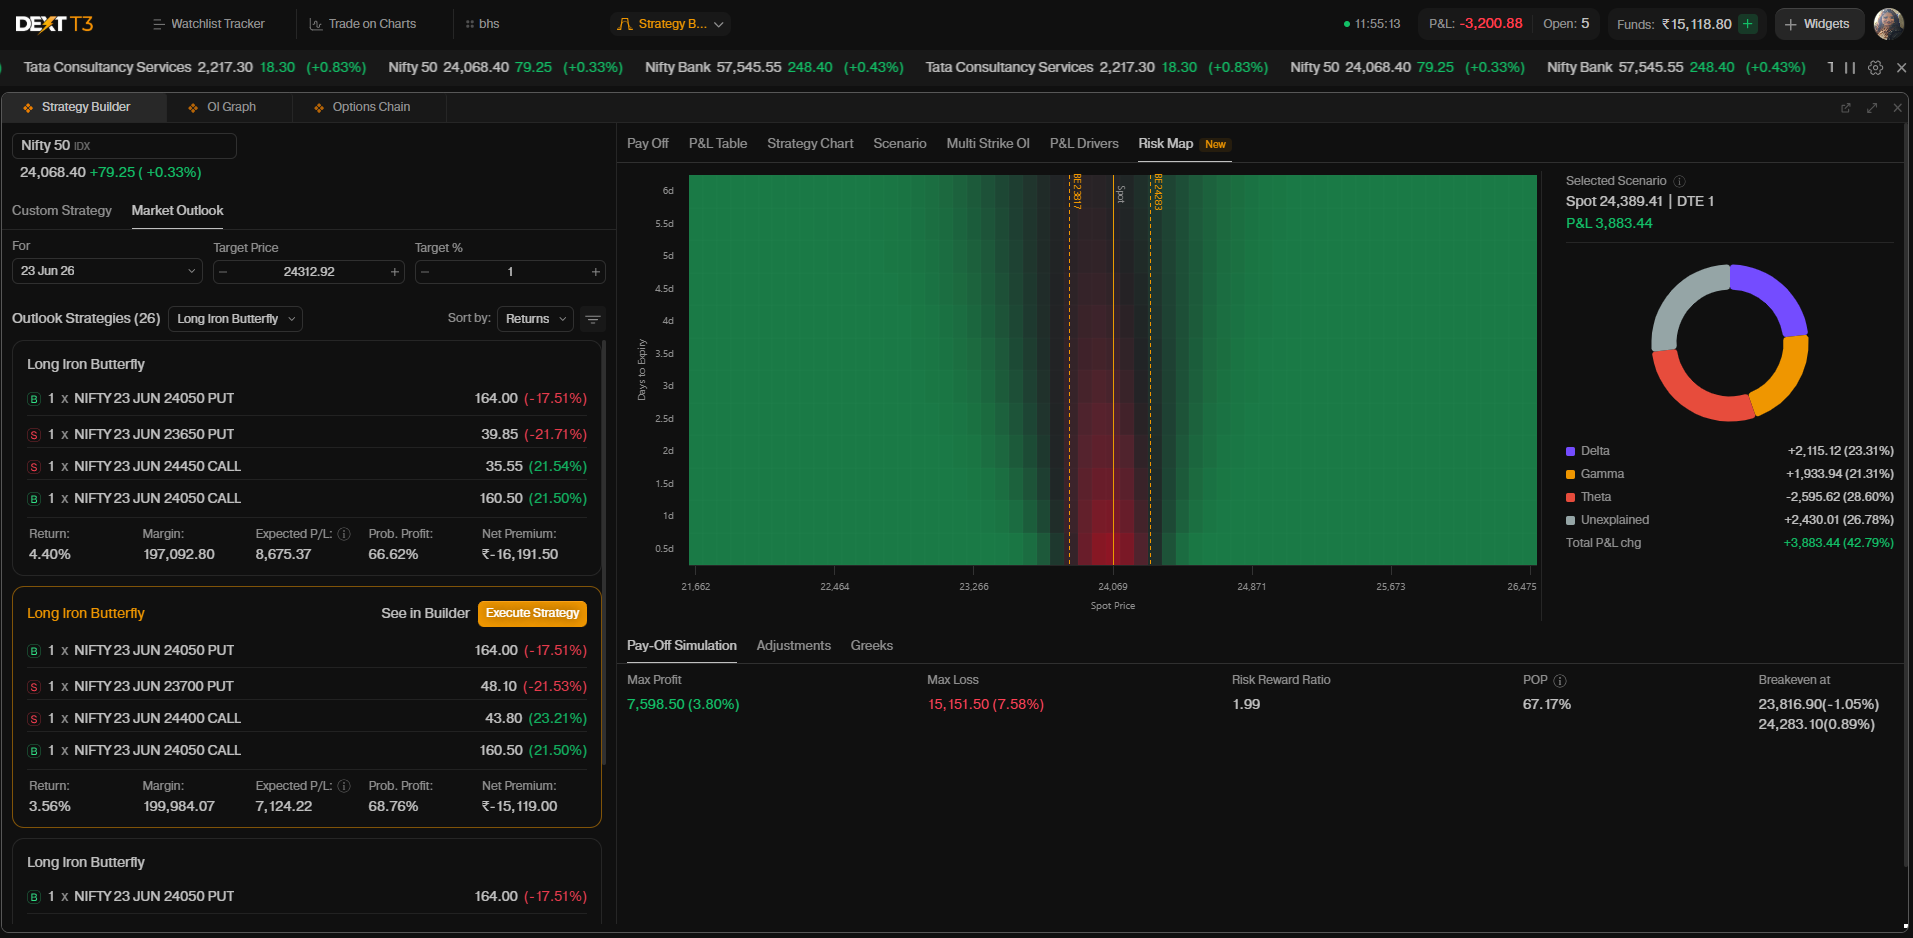
Two additions this month build directly on top of that. Market Outlook Strategies flips how you pick a structure - instead of scanning through strategy names and matching each one to your thesis, you tell it your view - Bullish, Bearish, Range-bound, or Volatile - and Strategy Builder surfaces the strategies that align with it, max profit, max loss, and breakeven already worked out. Open one directly in the builder, check the payoff, execute.
Risk Map is also live now - a 2-dimensional view across spot price and days to expiry that shows where a position makes or loses money before the market actually gets there, instead of the one static moment a regular payoff graph shows you. We’ll walk through how to read it properly in a dedicated post over the next few days - for now, it’s live inside Strategy Builder if you want to start exploring it yourself.
Greeks Exposure
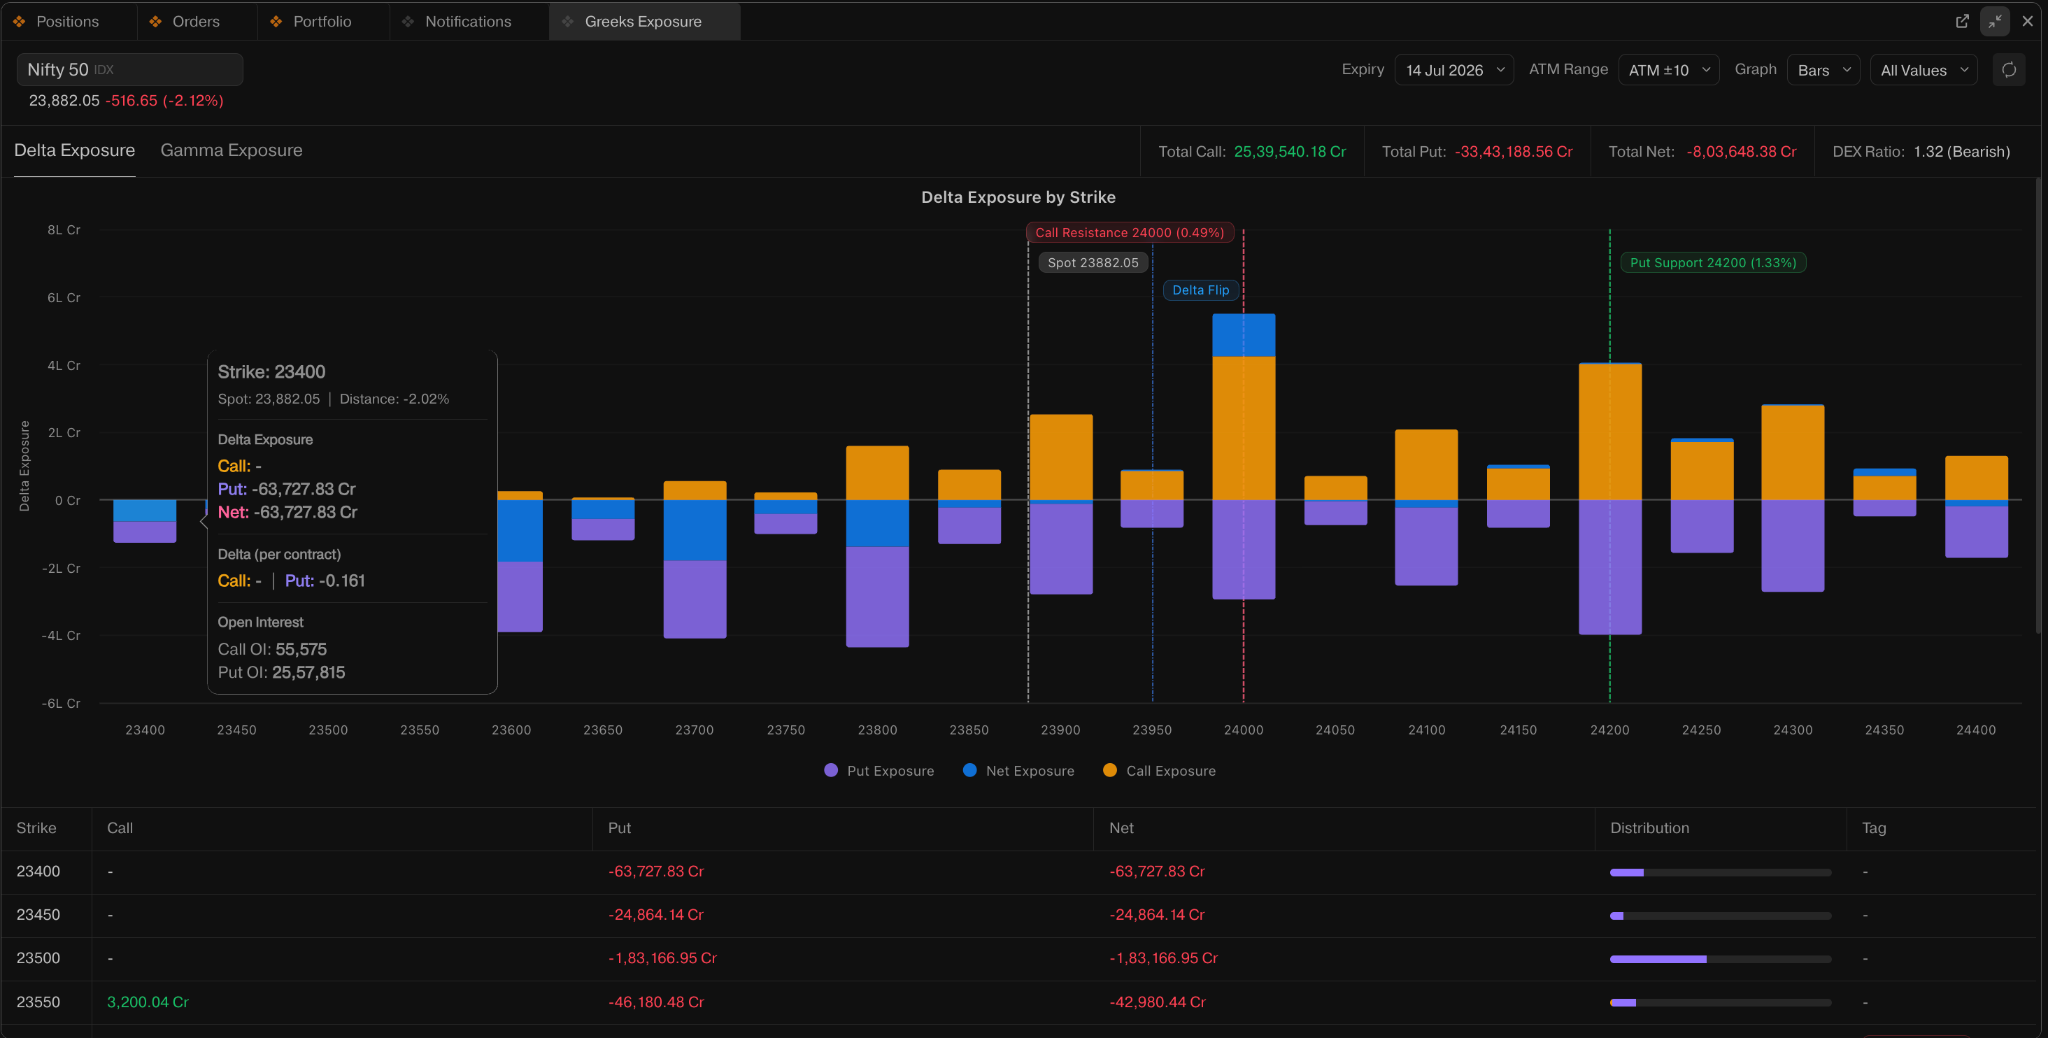
Also new this month - Greeks Exposure, a dedicated view of Delta and Gamma exposure across the option chain, built to help you read where the market is positioned without doing that math yourself strike by strike. It runs on two tabs: Delta Exposure, which shows how much directional risk is sitting at each strike, and Gamma Exposure, which shows where hedging activity is likely to intensify if spot moves. Calls read positive, puts read negative, and a few key levels get marked automatically on the chart - where call and put exposure peak, and the Flip level, where net exposure changes sign and behaviour on either side tends to look different. A summary read up top - Stabilising, Volatile, or Neutral - tells you the broad posture without you having to work it out. There’s enough packed into this one that it deserves its own post - we’ll go deeper into how to actually read it soon.
Order Flow Goes Deeper: Cumulative Delta
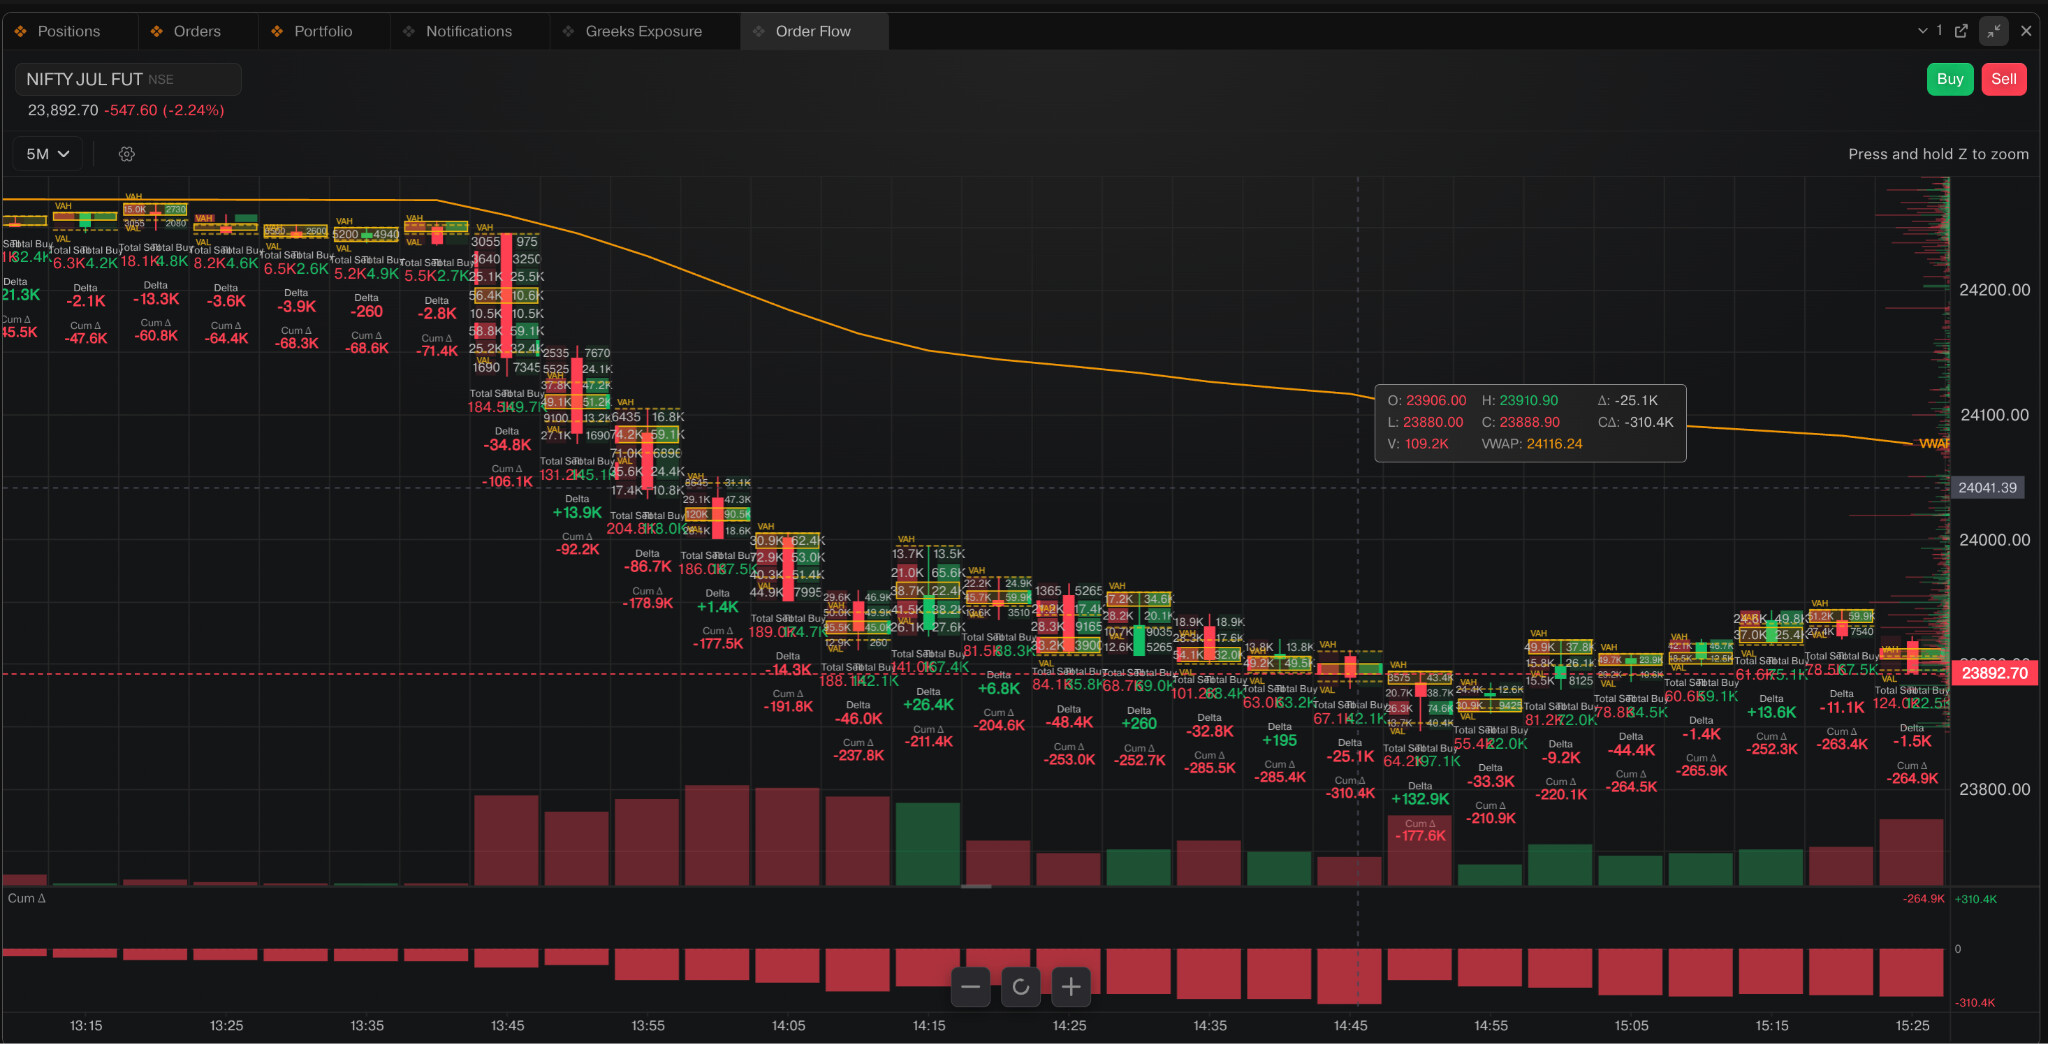
“The buy/sell split tells me who’s active in this candle, but who’s actually winning over the session?” - that was the ask. Order Flow now tracks Cumulative Delta alongside the per-candle Buy/Sell split, so you get a running read of buying versus selling pressure as the session builds. If price keeps pushing one way but cumulative delta isn’t backing it up, that’s usually worth a second look before you treat the move as settled. We went deeper into reading Order Flow here - Cumulative Delta slots right into that same framework.
A few things around it got sharper too: POC now updates correctly the moment you click a candle, X-axis time on the 10-minute timeframe reads cleaner, and there’s now a zoom menu plus the Z shortcut for the magnifier, so you can drop into aggression detail without breaking your chart view.
Scanner-Based Alerts, Not Scanner-Watching
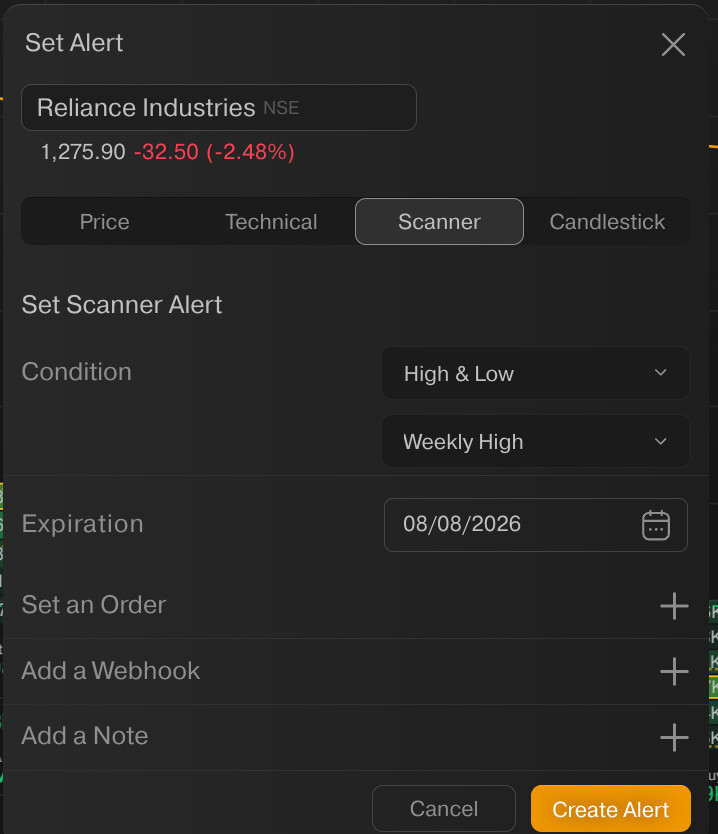
Live Scanner already covers a long list of conditions - High/Low levels (Day, Weekly, Monthly, 52-week), Pivot breakouts (R1/R2/R3, S1/S2/S3), circuit breaks, moving-average crossovers (9/50/100/200), volume reads (Potential Volume, Unusual Volume), and how far a stock is running from its highs or lows (Near High/Low, Recovery/Pullback). Running it used to mean keeping the widget open and watching for a match yourself.
Not anymore. Set it up from the same Set Alert window you already use for Price and Technical conditions - switch to the Scanner tab, pick your condition (say, Weekly High), set an expiration, and DEXT T3 notifies you the moment it triggers. You can attach an order, a webhook, or a note to the alert while you’re setting it up too. One thing worth knowing: it fires once per match, not on a repeat basis - if you want to catch the next one, you’ll need to set it again.
Cyclic Trend, Alongside RCG
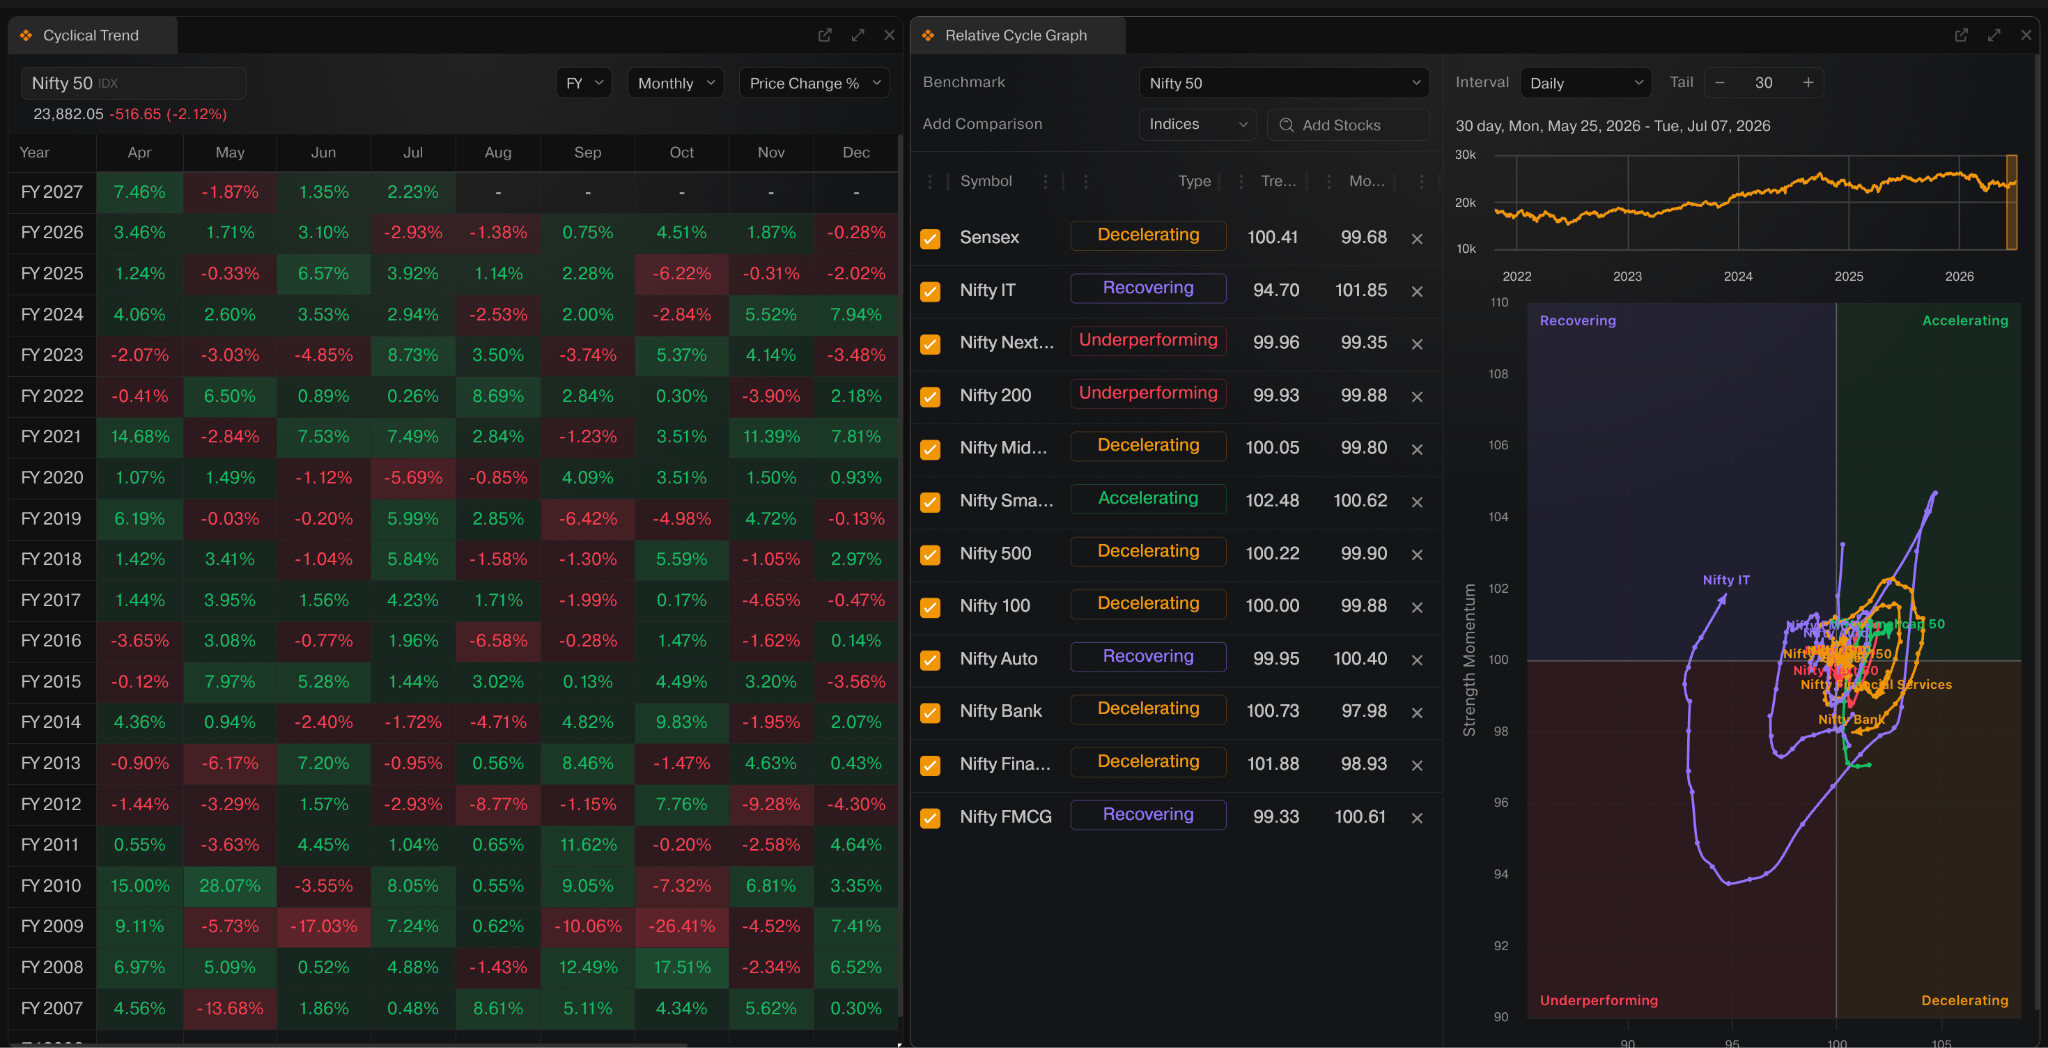
Cyclic Trend looks at how a single stock has historically behaved across months and quarters - Price Change, PE, PB, Dividend Yield, going back across more than a decade of data - its own seasonality, nothing to do with any other stock. You can switch between monthly and quarterly views, and between calendar year and financial year, to see whether a stock has tended to run hot or cold around a particular time of year. That’s a different question from Relative Cycle Graph, which compares a stock against its peers and sector to show which phase it’s currently in - Leading, Strengthening, Weakening, or Recovering - and tells you how it’s rotating against the pack, not against its own history. Put together, you get both reads now - a stock’s own seasonal rhythm from Cyclic Trend, and where it stands relative to its peers from RCG..
Scalper Widgets: Margin, Before You Click
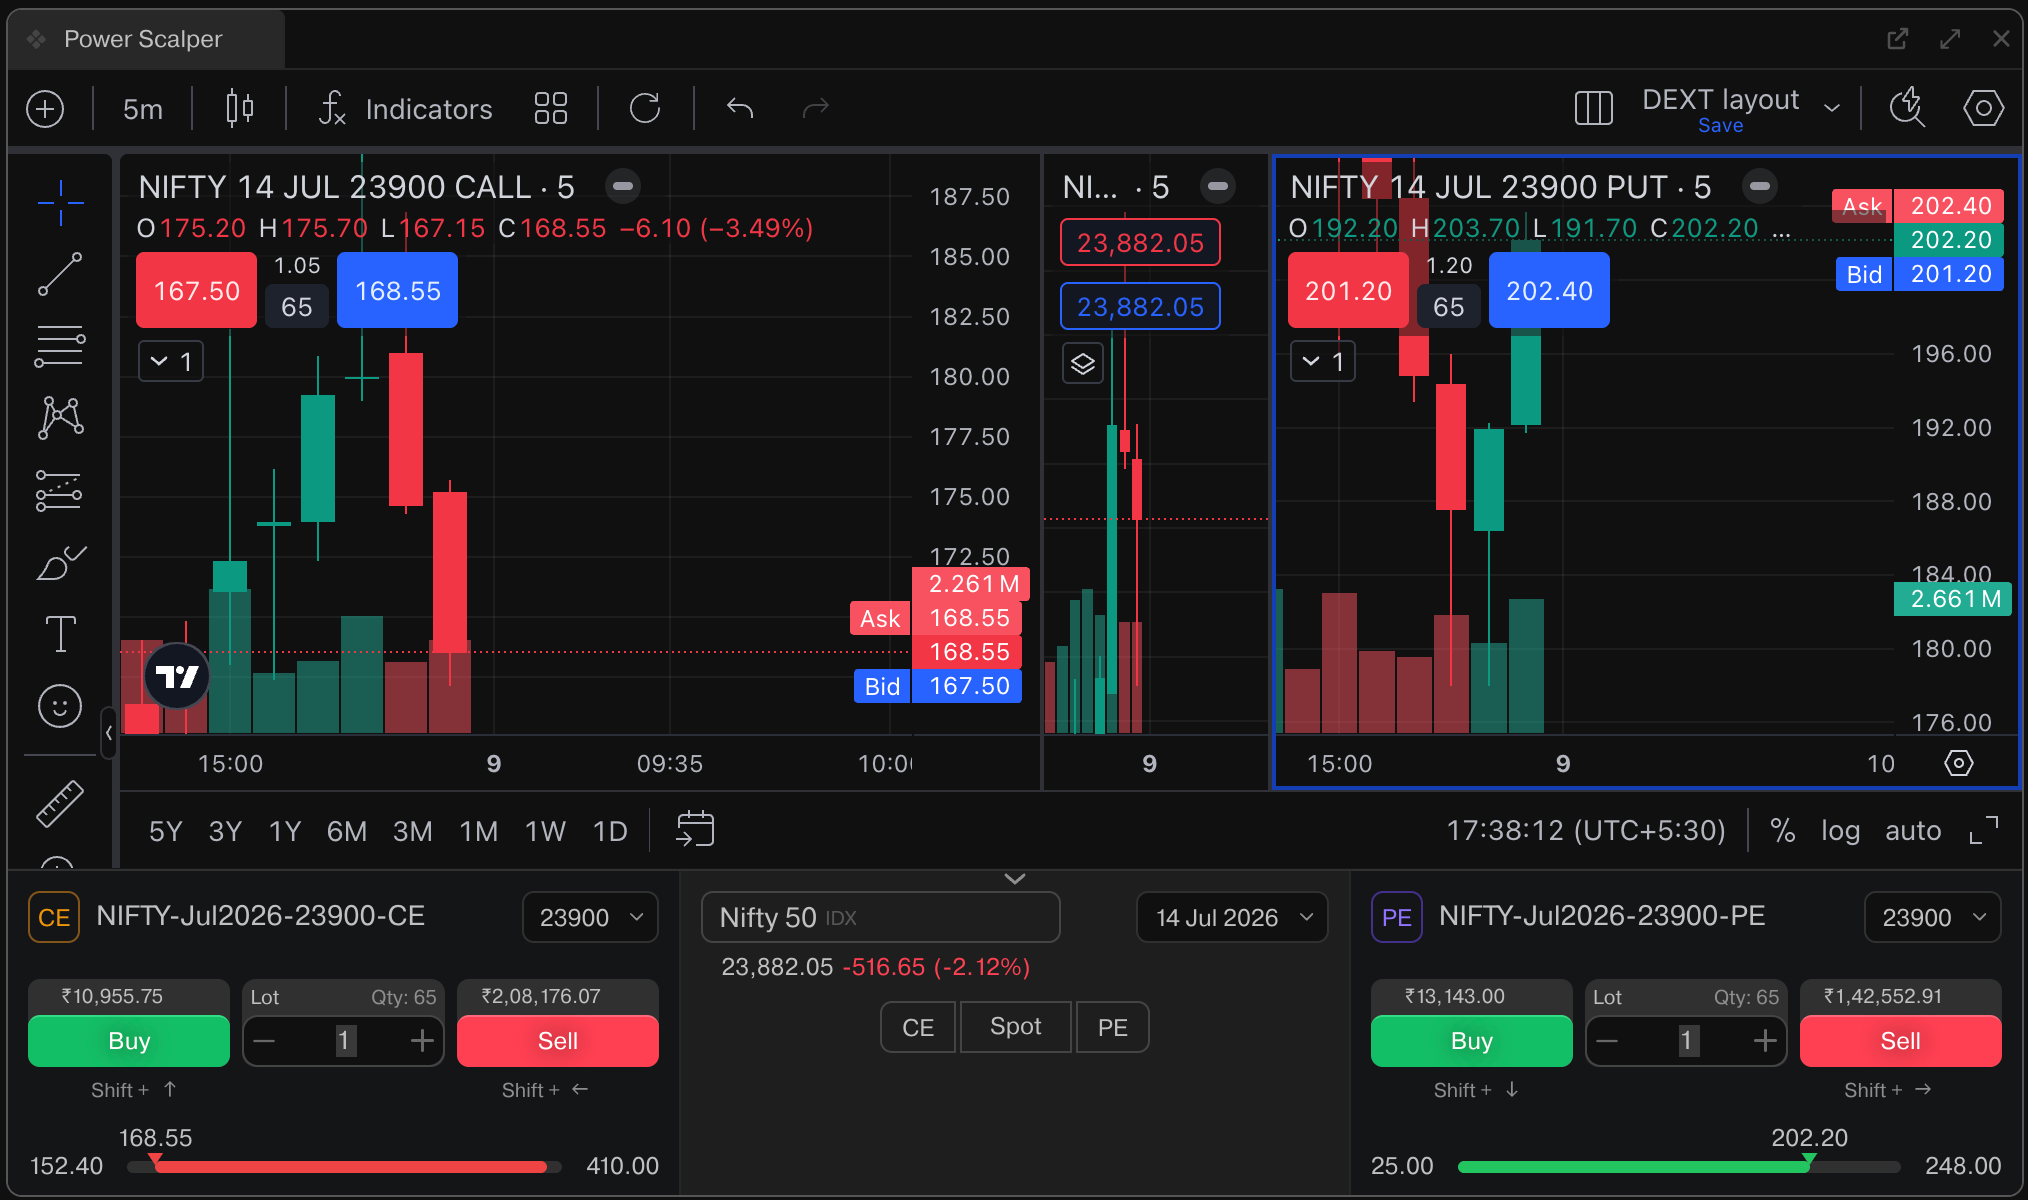
Across Power Scalper, Option Scalper, Floating Scalper, and Ladder, required margin is now visible before you place the order, and quantity input has moved to lots - so what’s on screen actually matches how you’re thinking about size, instead of finding out the margin number after the fact. You can also now type lots in manually instead of relying only on the +/- buttons. Price Ladder got more alongside this too: you can lock the view in place, volume fill now reflects real volume contribution correctly, and depth improved - full depth on MCX, 5-level on BSE.
More June Updates:
-
Widgets:
-
Buy/Sell buttons now show up on hover across Watchlist, Movers, Trending, Corporate Actions, and ETF views, with a setting to turn them off entirely if you’d rather not have them.
-
Arrow-key navigation on Watchlist and Movers now updates the selected symbol across every colour-synced widget at once - step through with the arrow keys, and Charts, Order Flow, and everything else linked in that layout follow along.
-
Column shuffling and resizing now stick across Indices, Time & Sales, Live Scanner, and Corporate Actions.
-
Multi-login is live now - switch accounts without logging out first.
-
-
Analytics: Option Chain Insights - ATM IV & % Change, PCR, Max Pain - can now be hidden or shown, useful when you’re running the widget small. Corporate Actions now supports right-click to transact directly, and the Indices Heatmap has a list view alongside the grid, with the same direct-transact option built in.
-
Settings: Labels and helper text are clearer across the board - Update Synced Widgets with Arrow Keys, Auto-Sort on Live Data, and Show Buy/Sell Buttons on Hover now explain exactly what each toggle does. Nav Bar Data is now Top Bar Data.
-
Orders: A new MessageBar shows order-related messages more clearly as they happen; orderbook symbol display and stop-loss full-exit quantity behaviour have both improved.
-
Notifications: Fixed the duplicate notification issue where you’d see both a chart notification and a toast message for the same order.
-
Charts: Drawings on expired option contracts stop eating into your layout storage once they’re no longer relevant.
-
Option Scalper & Charts: Colour-synced new option contracts now stay intact when you click on the chart.
-
Layouts: Pinned layouts correctly persist on relogin and refresh now instead of resetting to the first three system layouts, and creating a new layout correctly shows the predefined selection screen again.
-
Power Scalper: Futures contract search shows the correct ATM strikes now, and the widget no longer fires orders when it’s out of focus.
-
Layout & Widgets: Symbol sync inside the Order Form is smoother, predefined layout save issues are fixed, and EXE close behaviour after a layout change is cleaner.
-
Alerts & Search: Edit Alert and Stock Search windows stay steady now while you’re selecting price or text.
-
Market Data: Movers correctly categorises stocks under the 52-week High/Low sections.
-
Basket Orders: AMO basket orders show the correct market-closed alert.
-
Strategy Builder: MCX contracts added to a strategy show correct prices instead of zero.
A good chunk of this list traces straight back to threads right here - the pop-out ask, the chart-sync ask, the delta ask on Order Flow, the margin-visibility feedback on scalper widgets. Thanks for staying on us about it.
Explore what’s new, build the setup that actually works for how you trade - and if something’s still bugging you, tell us below. We’re always listening, and always building with you. 
Explore DEXT T3 on browser: https://dext.dhan.co/
Download on your Mac or Windows: https://dhan.co/dext-t3-trading-terminal/
Happy Trading!
Bhavya