Dear Traders & Investors,
At Dhan, we have focussed on building a complete experience for you - which means you have everything and anything for all your trading and investing needs. We may not be there yet, but we are getting there adding a block one after another.
With this core principle guiding our actions, the Dhan ecosystem currently includes 6 trading platforms, and hundreds of features that have been launched across these platforms from time to time. As we say - Dhan gets better every day. Our platforms, products, features and offerings cater to a wide range of personas and are designed for all types of trading and investing styles.
Dhan started with its flagship platforms - Dhan App & Web, later introduced DhanHQ Trading API stack for algorithmic and systematic trading, also Options Trader App & Web for derivative traders in Index, Equity and Commodity; and last not but the least our very own charting console on partnership with TradingView in tv.dhan.co that helps traders on charting, technical analysis and also trading directly from charts. We strive to bring best-in-class trading & investing experience to you, help you trade fast, manage your positions seamlessly all through our own in-house trading systems.
With all this - our users, including us at times felt there was a missing link. Dhan is an execution-only platform and offers no research / advisory services like many traditional / bank-led brokers.
We realised that for many traders & investors, even ones who are experienced - identifying the right market opportunities and staying updated with market trends can be challenging. Information is scattered across multiple platforms, making it even more difficult to keep a track of markets. With thousands of listed stocks, 180+ stocks that trade in futures & options, quarterly financial statements and announcements, FII and DII activity, price actions, candlestick patterns, technicals, news and many other things - it all can be an overwhelming experience.
We are delighted to bring our newest product, with which we aim to solve this via a data driven approach with the introduction of ScanX - a Stock Screener and Market Research Platform brought to you by Dhan.
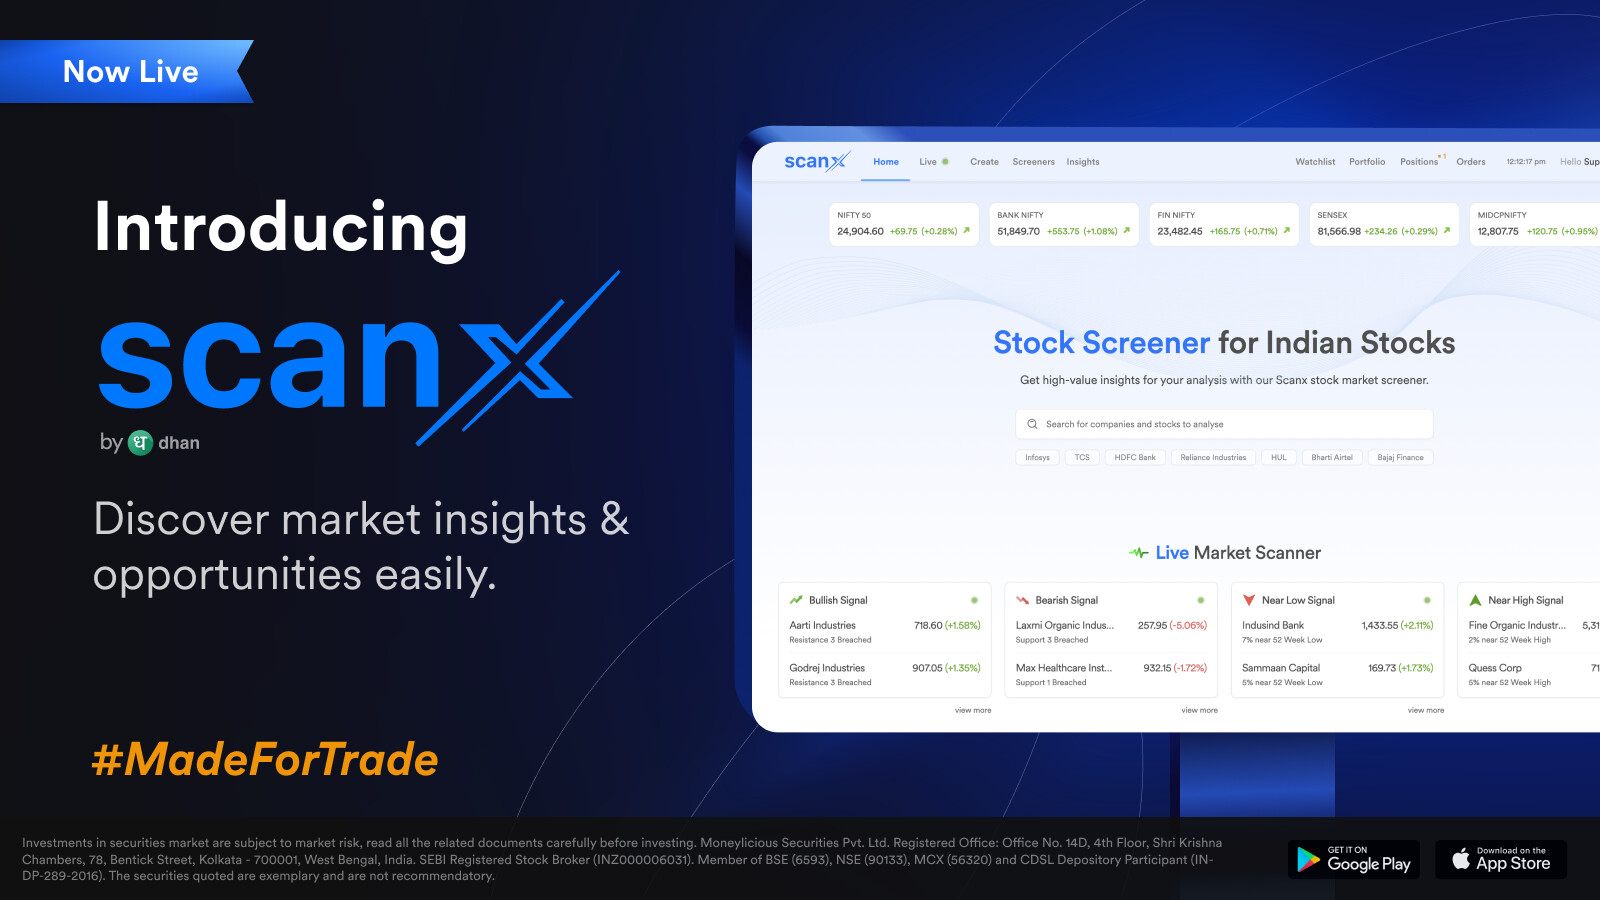
ScanX offers all the data, tools and features needed to screen stocks based on your ideas, whether technical or fundamental. Additionally, it provides extensive datasets and information on the broader market and individual stocks for research. Let’s discuss each section on ScanX in detail below.
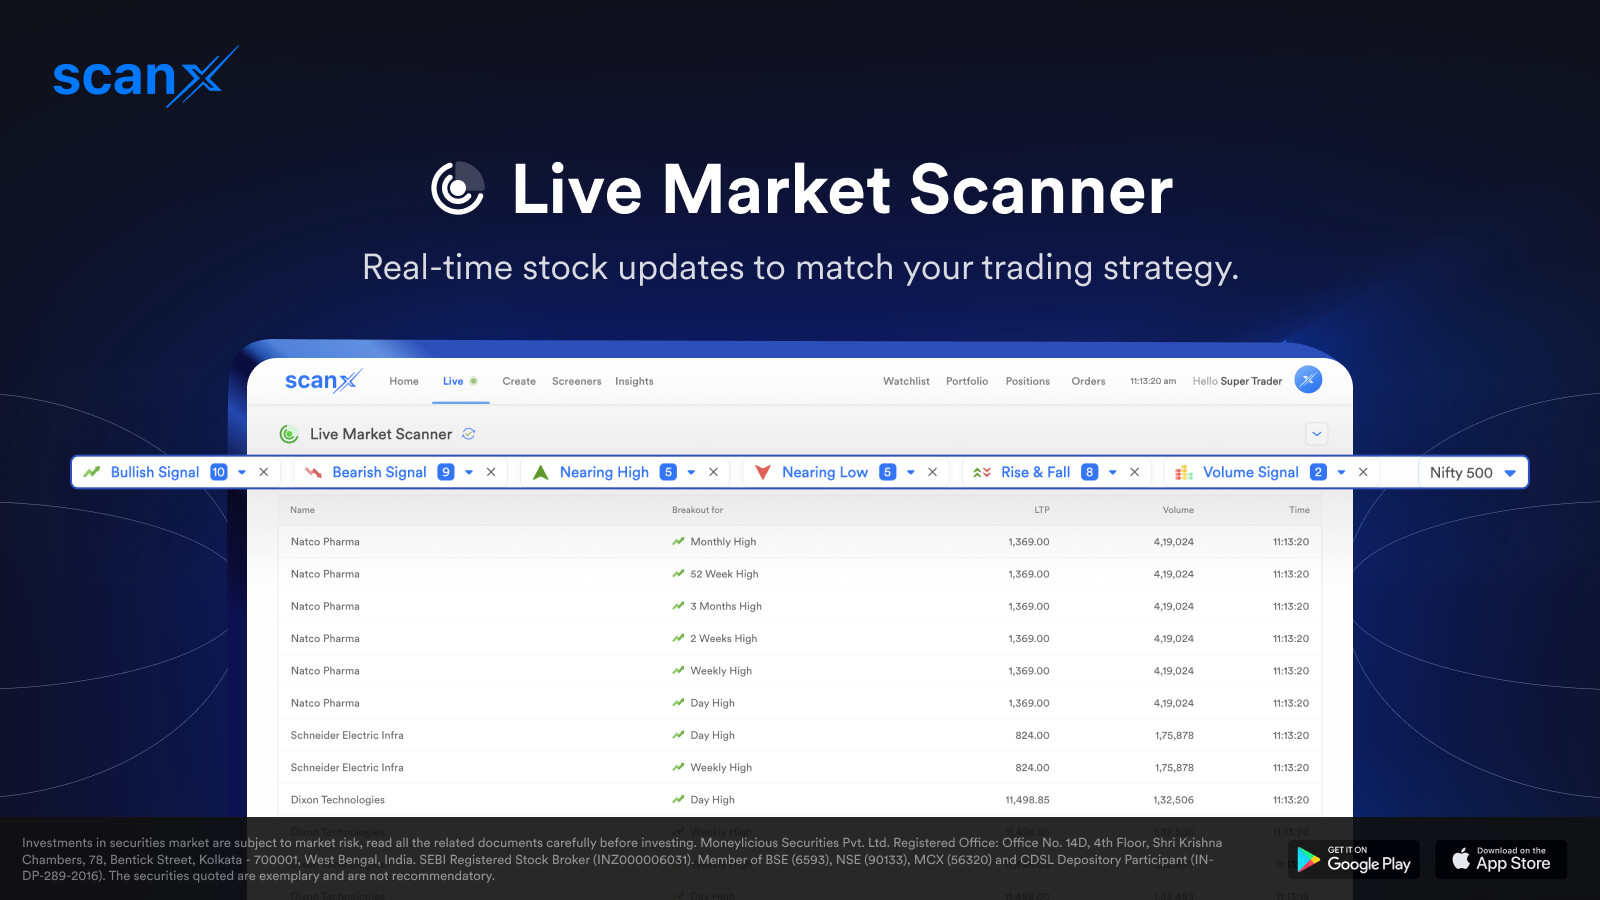
Live Market Scanner
ScanX provides a real-time feed of stocks that meet your desired conditions from a selected cohort of stocks. These conditions can be based on price action, volume, or other criteria.
For example, if your strategy involves buying stocks when they cross a 52-week high in your chosen group of stocks i.e.Nifty 500, tracking all 500 stocks for this condition can be challenging. In such cases, the Live Market Scanner is a handy feature. You can select a 52-week high as a bullish signal and Nifty 500 as the group of stocks. Any stock that matches these conditions will appear on your screen in near real-time.
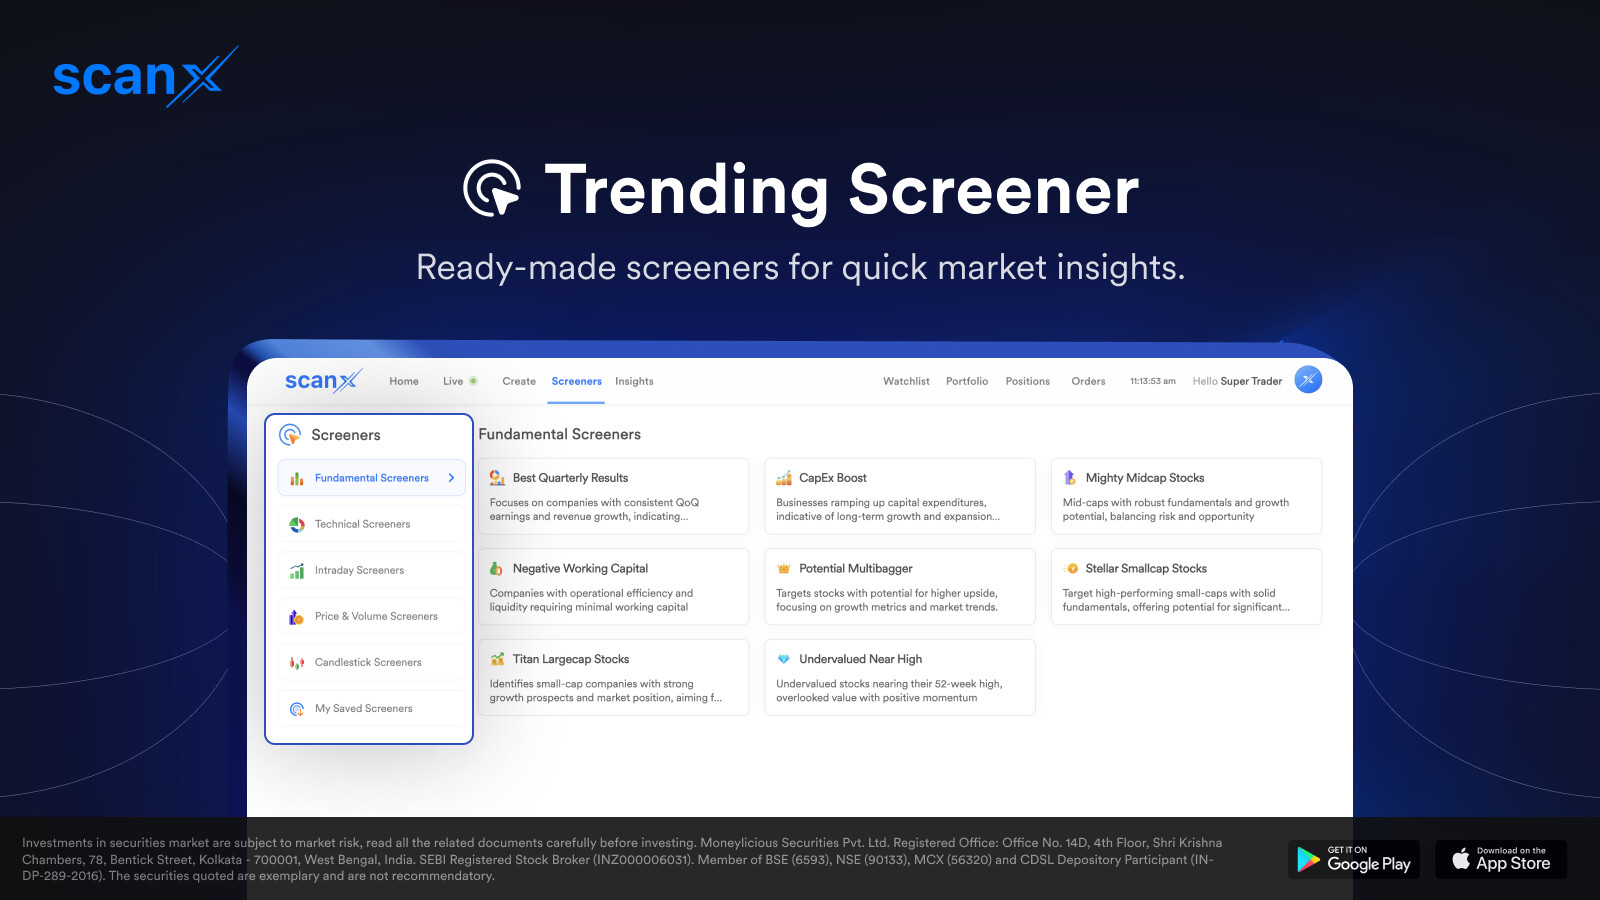
Trending Screeners
Trending Screeners are ready-made screeners designed for quick reference, broadly divided into six categories:
- Fundamental Screeners: Based on financials, income statements, balance sheets, and cash flows of stocks.
- Technical Screeners : Based on technical indicators on a daily timeframe.
- Intraday Screeners : Based on same-day price action or 15-minute time frame indicators.
- Price & Volume Screeners : Based on price and volume levels.
- Candlestick Screeners : Based on reversal and continuation of candlestick patterns on a daily time frame.
With over 50+ ready-made screeners available, you can track and observe various market dynamics effectively. While these tools provide a robust starting point, it’s important to critically evaluate and adjust these screeners based on ongoing market conditions and individual analysis.
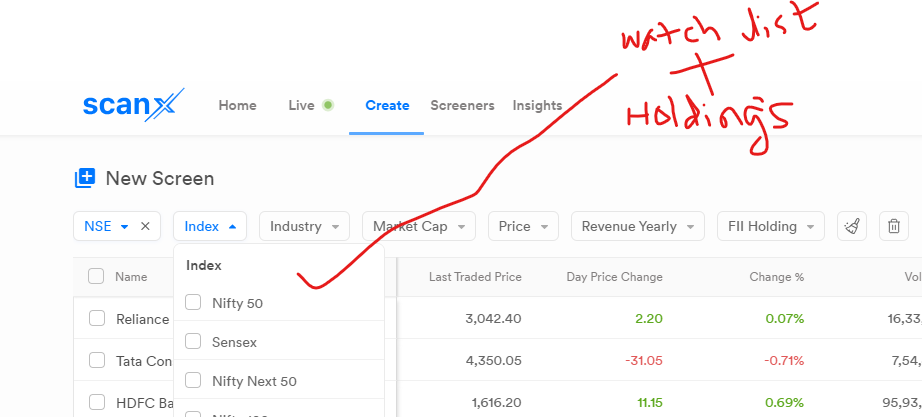
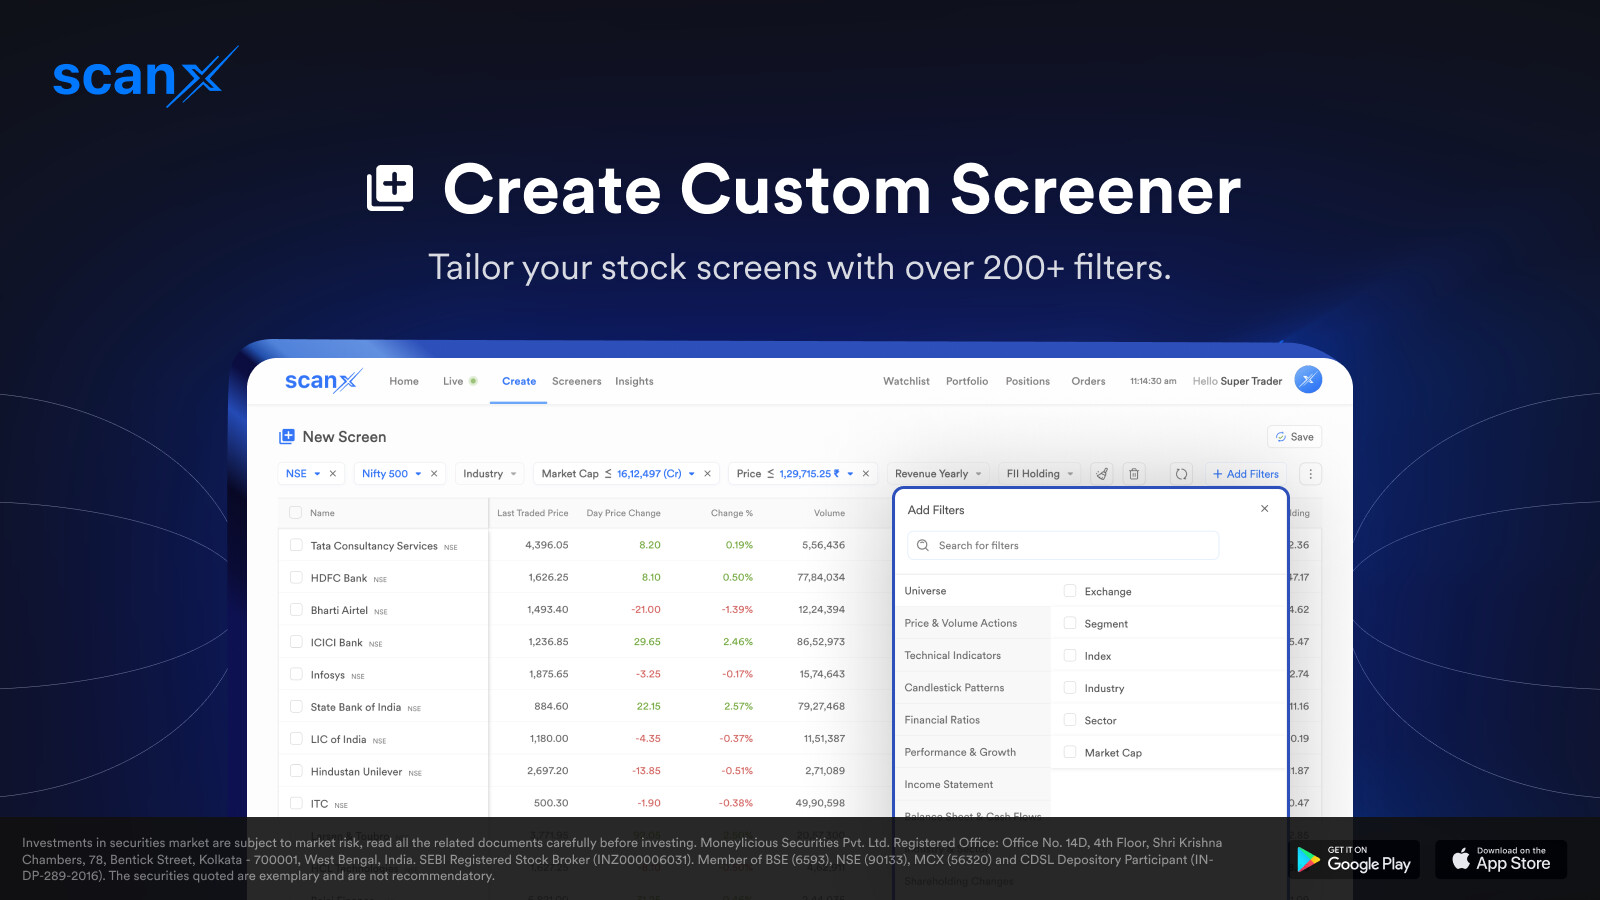
Create Custom Screener
In addition to the ready-made screeners, there is an option to create customised screeners with over 200+ filters across various categories. These categories are explained below:
- Universe : Broader filters for stocks, such as exchange, industry, sector, etc.
- Price & Volume : Filters based on price action and volume, including high and low breakouts.
- Technical Indicators : Over 35 technical indicators available on different timeframes.
- Candlestick Patterns : Filters based on daily timeframe candlestick chart patterns.
- Financial Ratios : Important ratios derived from a company’s fundamentals.
- Performance & Growth : Key metrics that help analyse a company’s performance.
- Income Statement : Profit & loss statement of the company, including revenue, EBITDA, net income etc.
- Balance Sheet & Cash Flow : Essential key fundamental numbers.
- Industry & Sector : Key metrics at the industry and sector levels.
- Shareholding : Filters based on shareholding patterns and their changes.
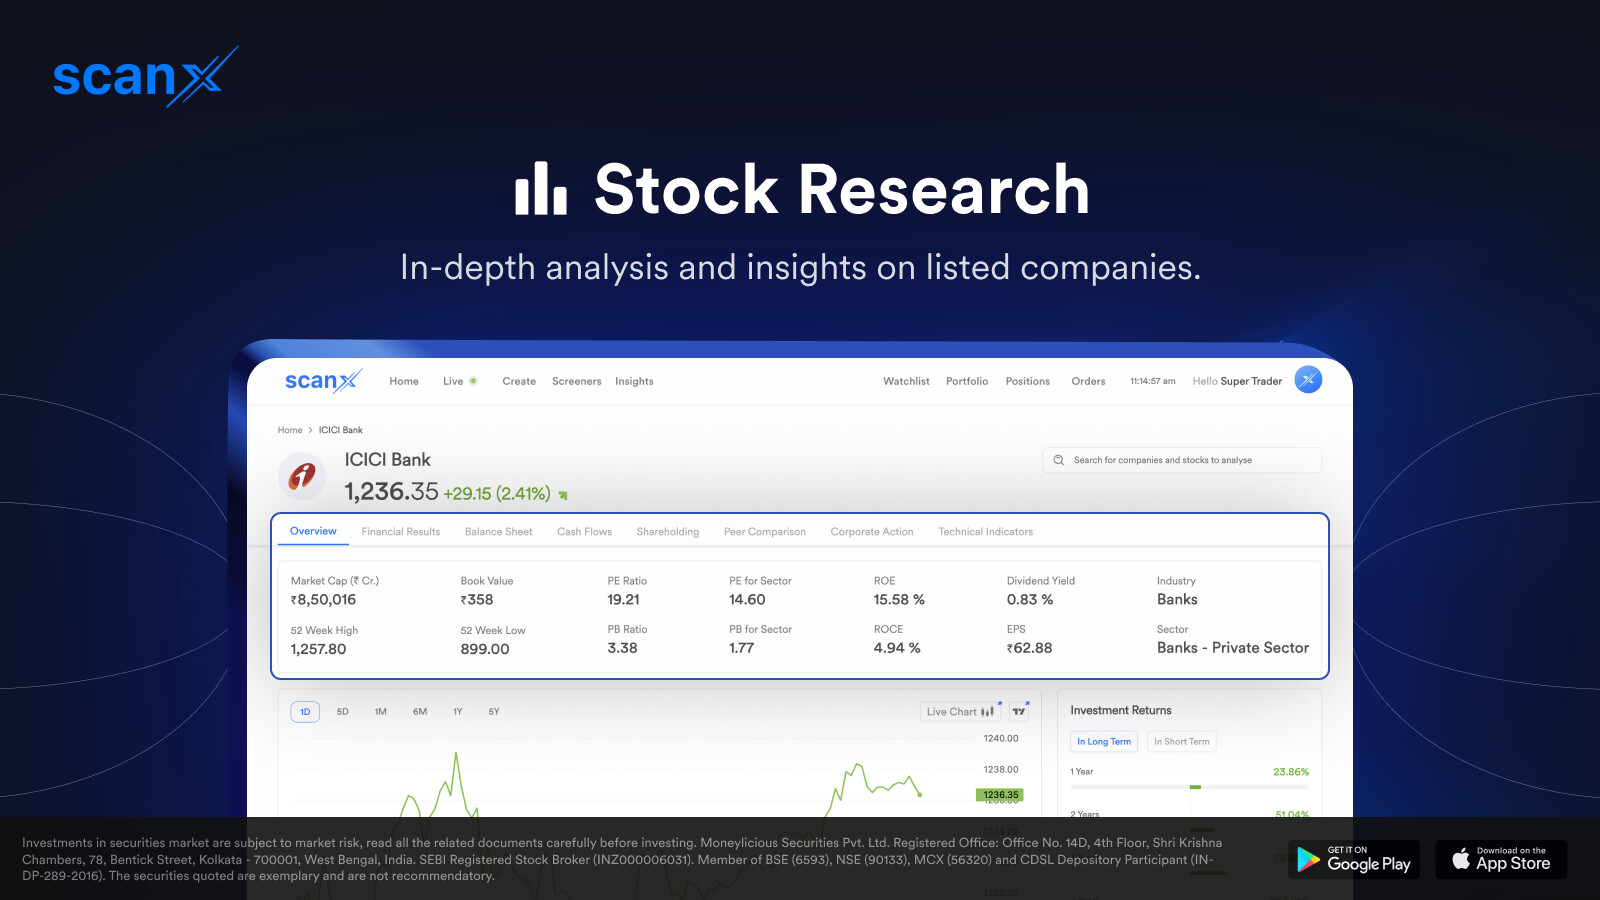
Stock Research
After screening, you will likely want to read and study more about specific stocks. For this purpose, we offer detailed and dedicated pages for all listed companies. Simply click on the stock name or search using the search bar.
These pages provide a summary with key numbers to help analyse the company’s financial health and performance. You can compare it with peers and broader market indices. The pages include details of the company’s profit and loss statement, balance sheet, cash flow, corporate actions, shareholding patterns, and technicals. Additionally, you will find a list of screeners that featured the stock. Let us know if you find this feature useful.
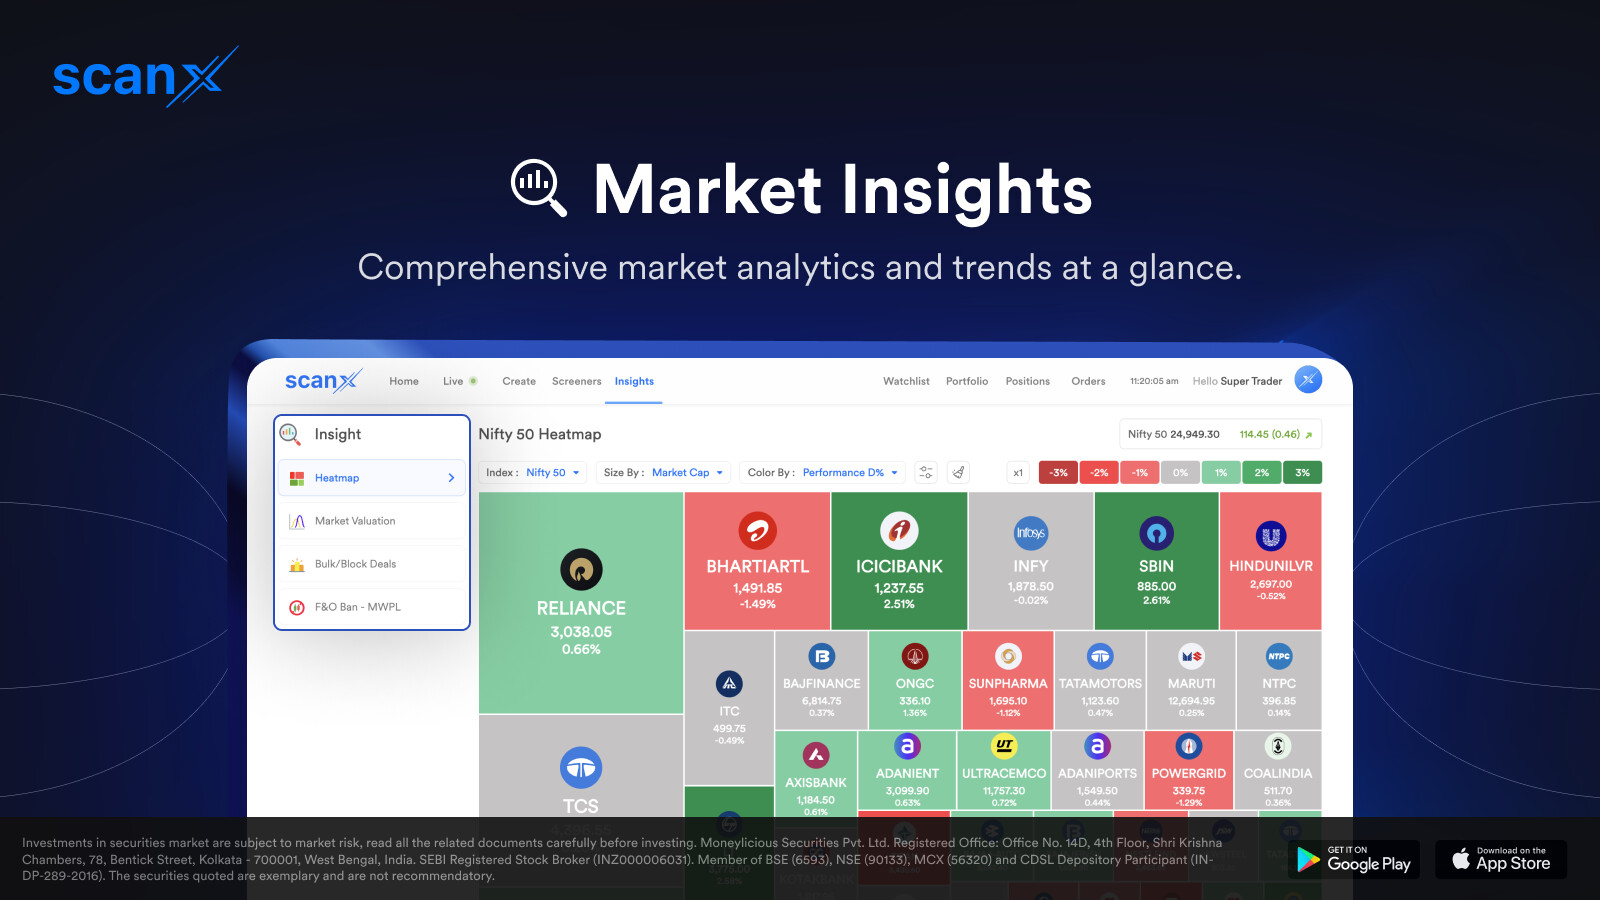
Market Insights
This was the detail about the individual stock, but there is a lot more that happens in the market. On this page you get the overall market analytics. This includes the following sub sections -
-
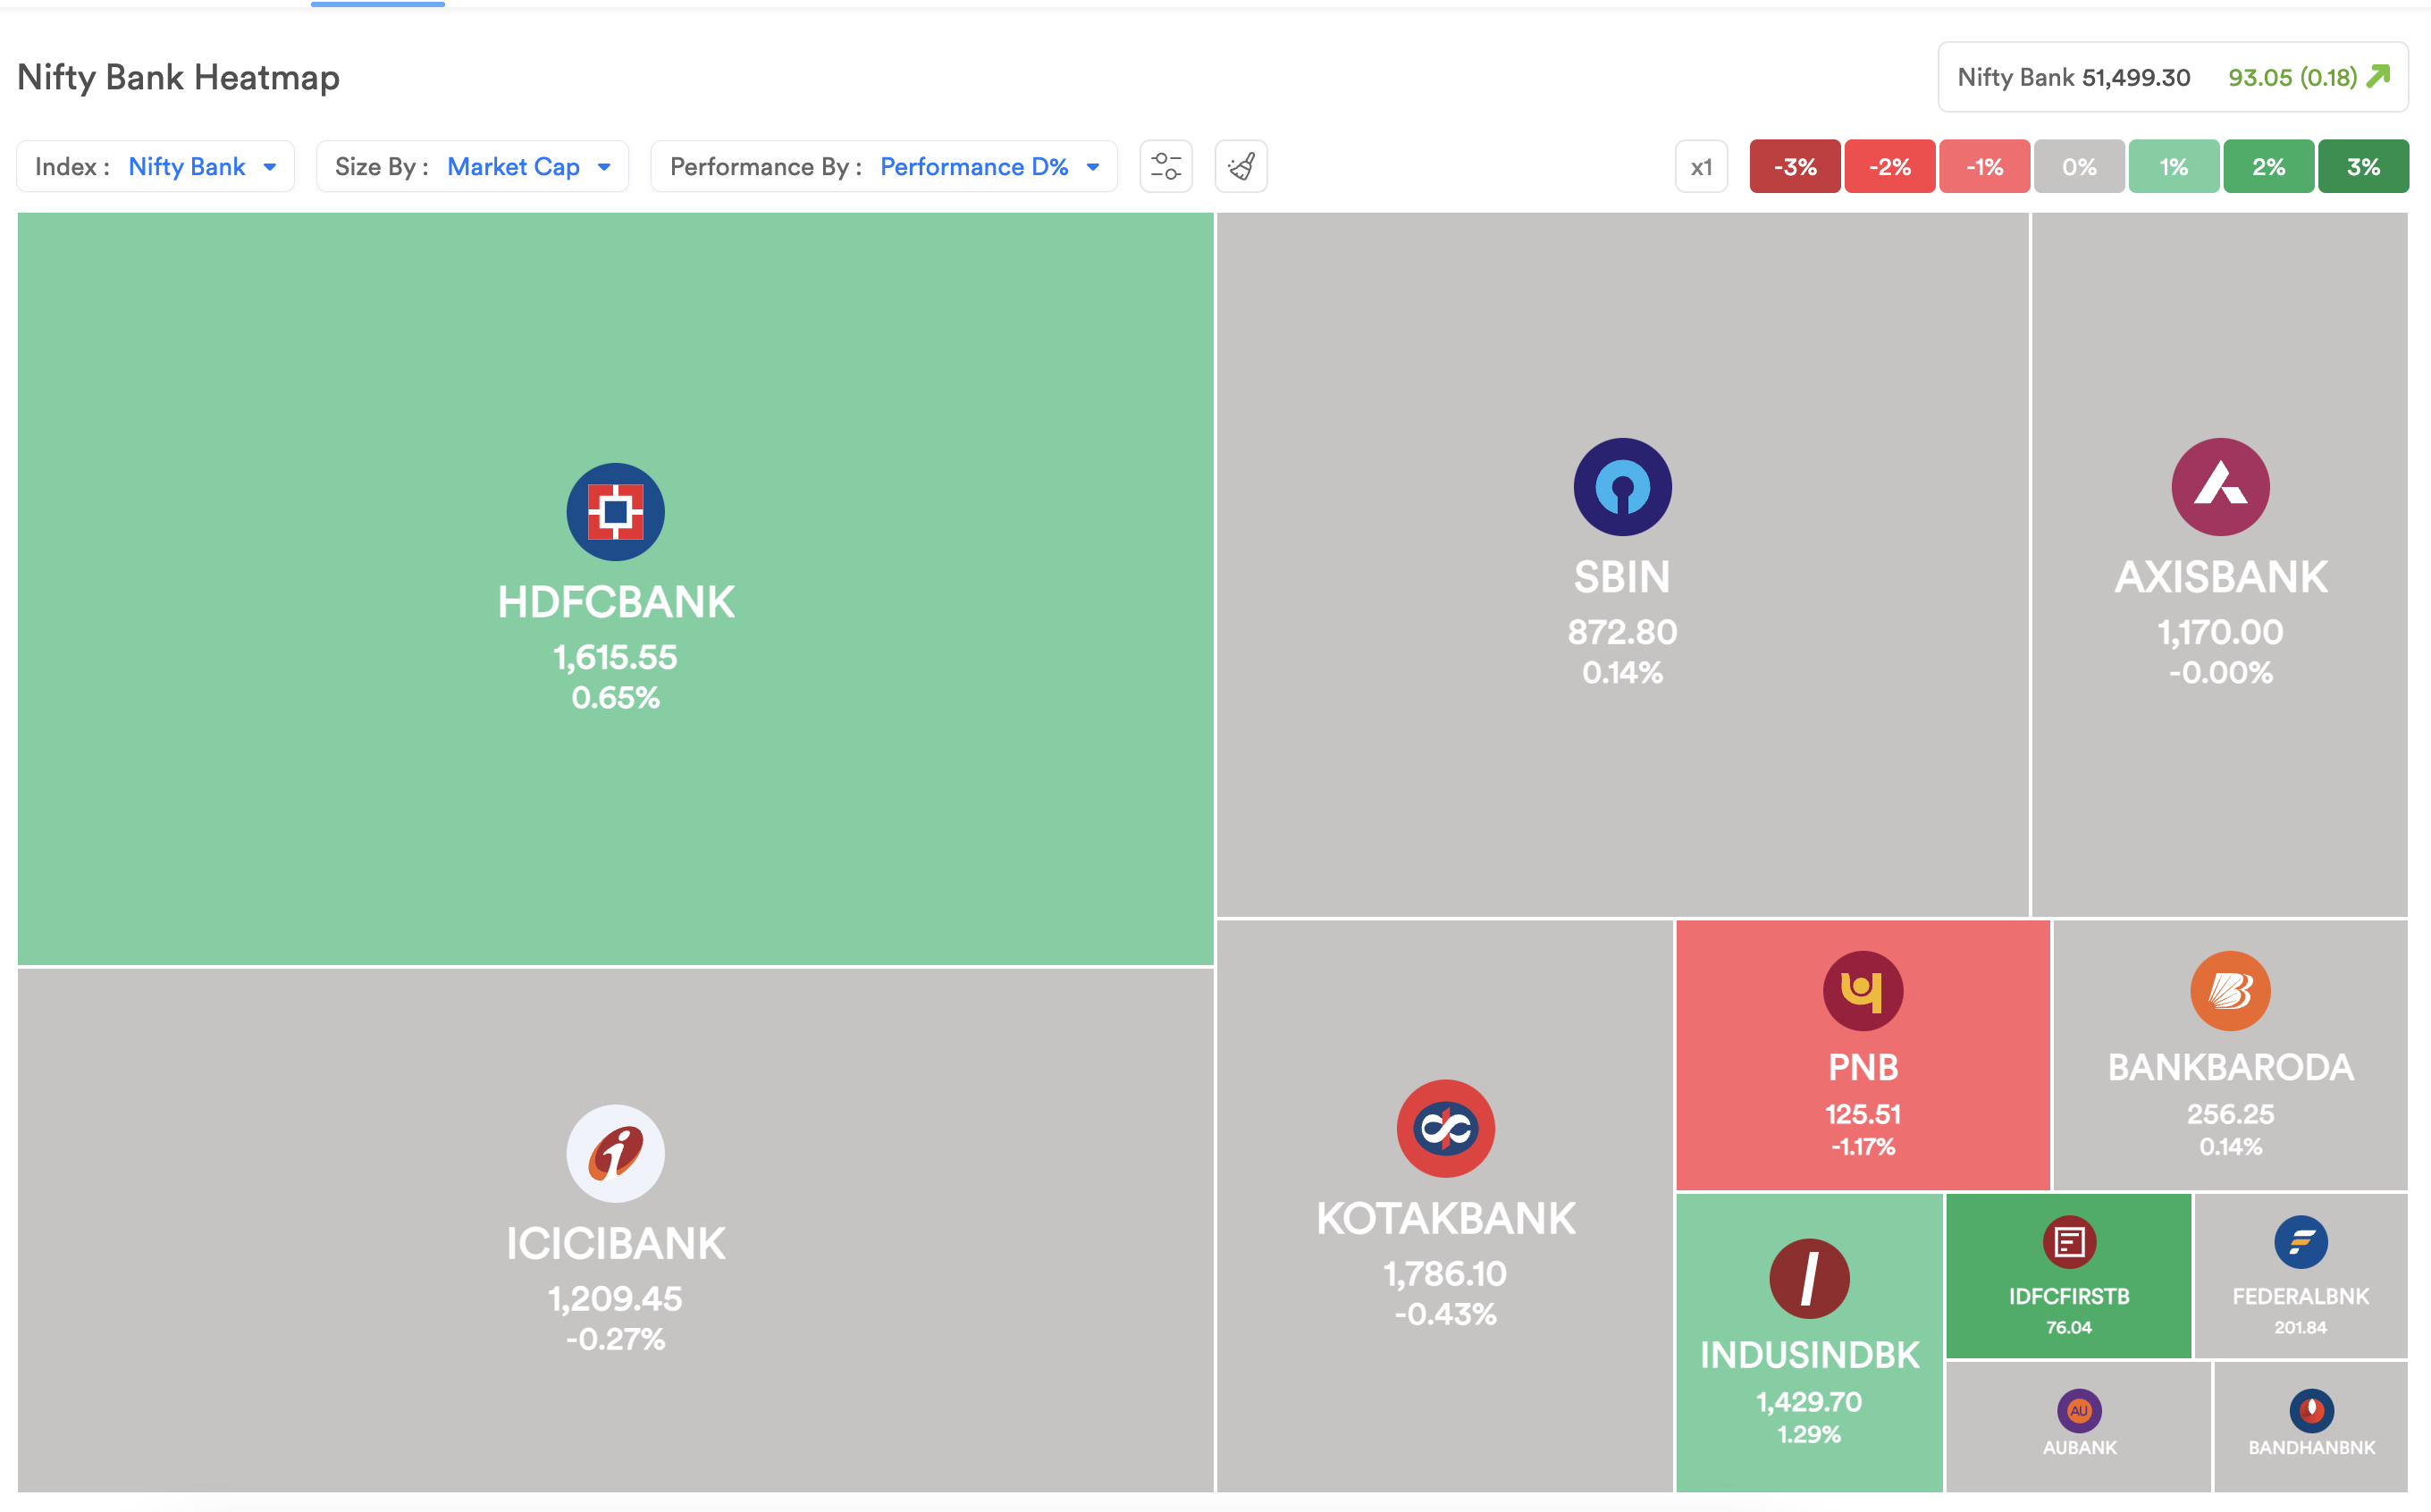
Heat Map: A stock market heat map is a visual tool that displays the performance of stocks or sectors using colour-coded boxes, where green indicates gains and red indicates losses. Boxes vary in size based on market capitalization or other number of choices. This provides a quick overview of market trends, helping investors identify opportunities and make informed decisions. This tool is valuable for assessing overall market performance, spotting sector trends, and comparing individual stocks.
-
Market Valuation: This feature helps you analyse & compare the different broader market indices & sectoral indices and study the valuations basis the PE ratio & PB ratio with historical trend & levels.
-
Bulk & Block Deals: This page gives you details of all the big deals that happen in the markets. These transactions indicate significant interest by institutional investors. Bulk deals involve trading 0.5% or more of a company’s shares in a single session and are publicly reported, potentially affecting stock prices. Block deals, involving at least 5 lakh shares or ₹5 crores, are executed through a special trading window to minimise market disruption and offer more privacy.
-
F&O Ban (MWPL): F&O ban is implemented in Stock Futures and Options whenever combined OI for any stock reaches 95% of Market Wide Protection Limit (MWPL) decided by exchange. We included MWPL tracker on scanx which helps you track instruments which are currently in ban period as well as ones which might potentially enter the ban list or take an exit from that list. This helps you be aware of instruments which are trading near upper limits of MWPL.
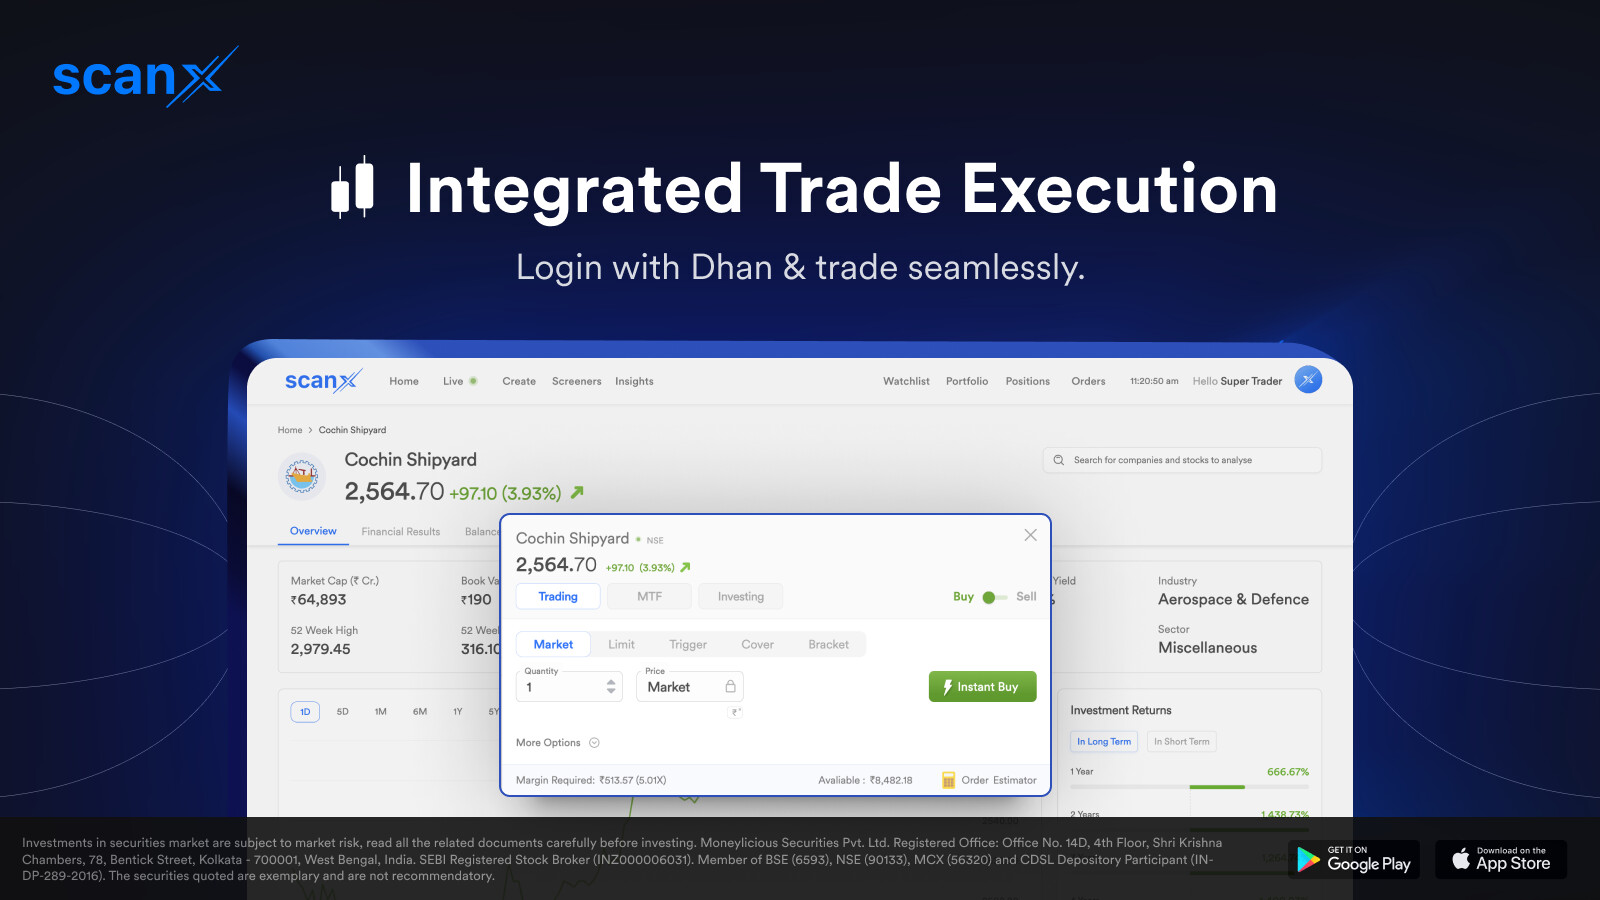
Trade Execution, Orders & Positions
Along with comprehensive market research and screening tools, the ScanX platform also offers trade execution capabilities through your Dhan account. All order types and position management tools available on the Dhan platform are integrated into ScanX. This makes ScanX the only platform to provide both screening and trade execution facilities in one place.
Watchlist / Portfolio / Charts
Your watchlist, portfolio, and charts on ScanX are exactly the same as on any other Dhan platform. All your stocks in the portfolio and watchlist, chart studies, indicator templates, layouts, and drawings are saved and synchronised across all Dhan products.
This concludes our introduction to ScanX. We will delve into detailed discussions on each module of this product in separate posts. This is just the first version of ScanX, and we are committed to continuous innovation. Expect to see new screeners, advanced features, and comprehensive datasets in future updates.
Start using ScanX here : scanx.trade
We encourage you to explore the platform and experiment with building your own screeners. Share your creations with us by posting the URLs in the thread below.
Your feedback and ideas are invaluable to us as we strive to make ScanX the ultimate tool for all your trading and investing needs. Stay tuned for more updates and enhancements.
Thanks & Regards
Naman