Changing wick color: Not on the Orderflow chart. I was asking about the “Range Bars Chart” Range bars chart let’s me change candle color, but it’s missing the option to change wick colors.
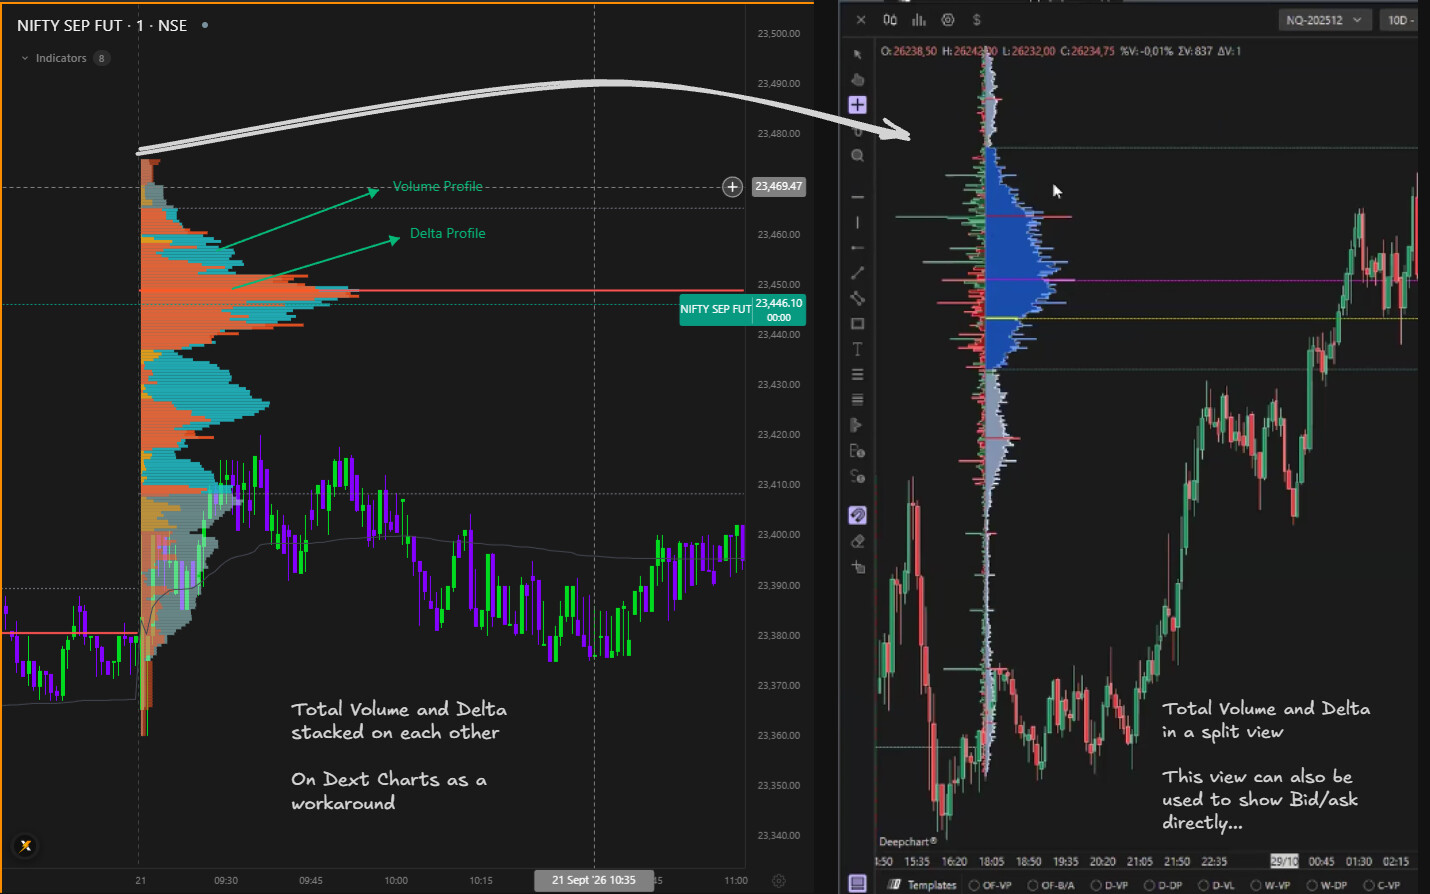
Delta on one side, volume on the other: I was not talking about Cluster chart. It was about volume profiles, session volume profile, fixed range volume profiles. Visually it can show both Total Volume on one side and Delta on the other side. As a work around, I have stacked Session Volume profile of Total Volume and Session Volume profile of Delta on top of each other. There’s an option to keep one SVP on Left orientation and another on right orientation. It would eat more screen realestate. Attaching an example…
And finally,
There’s inconsistency in the layout settings, Indicator settings being saved. If I close the app and restart, most settings are not preserved. Most indicator settings, color settings are not saved.
I have raised various concerns in another post, and while I have received responses there has been nothing done to address a lot of my problems.
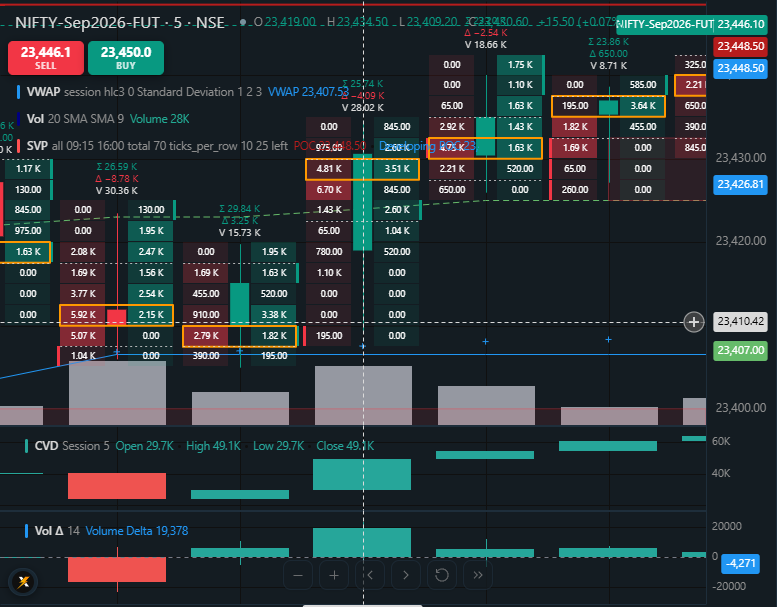
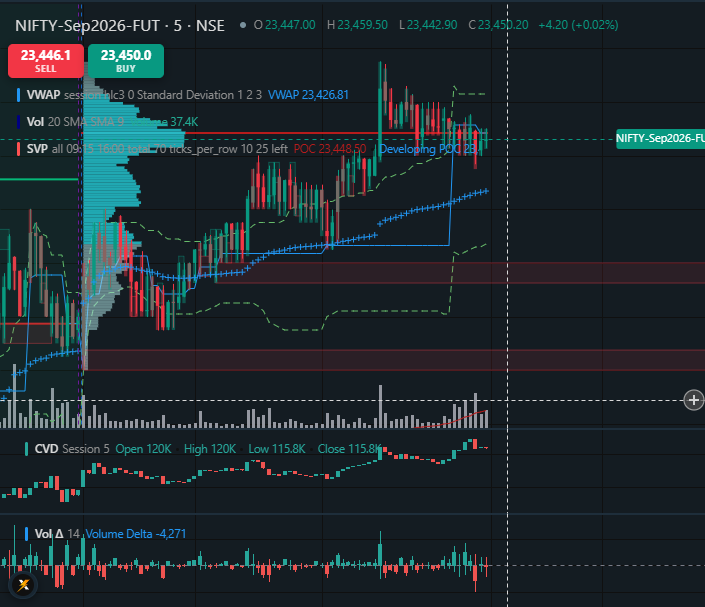
Most importantly the visibility of buy/sell volume numbers when zoomed out. Attaching an image for reference. The first one shows yesterdays chart on a 5 minute candle, and the second one shows the minimum amount I have to zoom in to see those numbers.
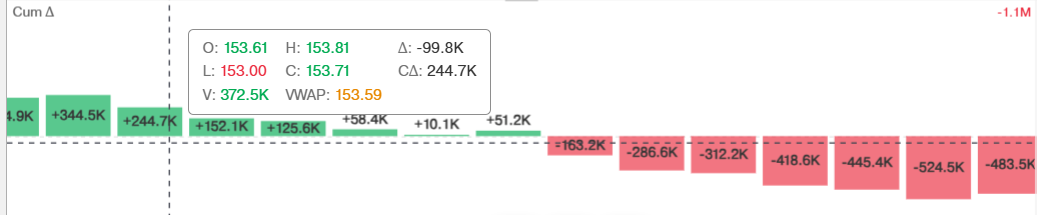
Alongside this, various issues remain, such as not being able to draw horizontal lines on an indicator. CVD is colored as per delta of that candle and not as per positive or negative value of CVD.
As a lot of others have requested, it would be greatly appreciated if the older version of order flow was still available for those who prefer to use it, at least until all these issues are ironed out.
We tried reaching you on both your registered mobile numbers. Please share a convenient time for a video call with our team so we can better understand your requirement and assist you accordingly.
Following our conversation on the call, we have addressed your queries related to Order Flow.
We have also noted your valuable feedback regarding indicators, bar colors in wicks, drag-and-drop for horizontal lines, shades in Order Flow, and Volume Delta Profile.
I have found that when applying cvd indictor to chart , the cvd pane is can’t adjustable like the price action pane. dhan team please make a look on it. make the necessary adjustment to adjust the cvd pane.
It’s cool to see dhan diving deep into order flow like this and building it out properly for traders. Happy to keep testing and sharing whenever useful.
Live Data Dynamics: The internal bid and ask numbers inside the candles are constantly fluctuating in real-time based on aggressive market orders and resting limit orders.
Cumulative Delta (CVD) & Imbalances: While CVD and diagnostic filters (like 3x+ diagonal buying imbalances and thin books) help identify institutional intent, analyzing them requires careful observation of the candle structure.
Zoom & Readability Constraint: Inspecting individual delta nodes, ask/bid volume distributions, and POC shifts requires zooming in very closely on the chart. Without proper scaling and zooming, the internal footprint numbers overlap and crowd each other, making it difficult to spot exact absorption or exhaustion zones instantly during live market hours.
@appani.muralikrishna Thanks for sharing this feedback. We’ve noted the request for alerts on strong Delta.
Could you also share how you would ideally want to define “strong Delta” and when you would expect the alert to trigger? This will help us understand the use case better.
Zerodha’s “In The Money” channel just put out a video on order flow. And if you think about who else it could realistically be about, GoCharting and Bookmap have had this in India but stayed niche. Dhan is the only one who’s put it in front of retail traders, free, integrated, at scale. So even without naming names, everyone watching knows exactly whose feature this points at.
The video’s technical point is true, no aggressor tagging in India, so footprint and delta is a heuristic, not a fact like it is on CME. But the conclusion that video lands on, “basically don’t bother and just watch price”, lands awfully conveniently for a broker that doesn’t offer this feature itself.
So I’d genuinely like your take, not a PR line. Do you see this the same way, as a competitor using a real but narrow data caveat to talk people out of wanting something you built and they didn’t? And separately, is there or will there be a public doc on how DEXT T3 actually classifies aggressor side, and what its real limitations are? Many people are pointing to the data discrepancy between Dhan and Gocharting , this could also be answered with such doc.
Would rather hear this straight from you than watch it get treated like neutral education, because it isn’t.
@Bhavya_Jain@PravinJ
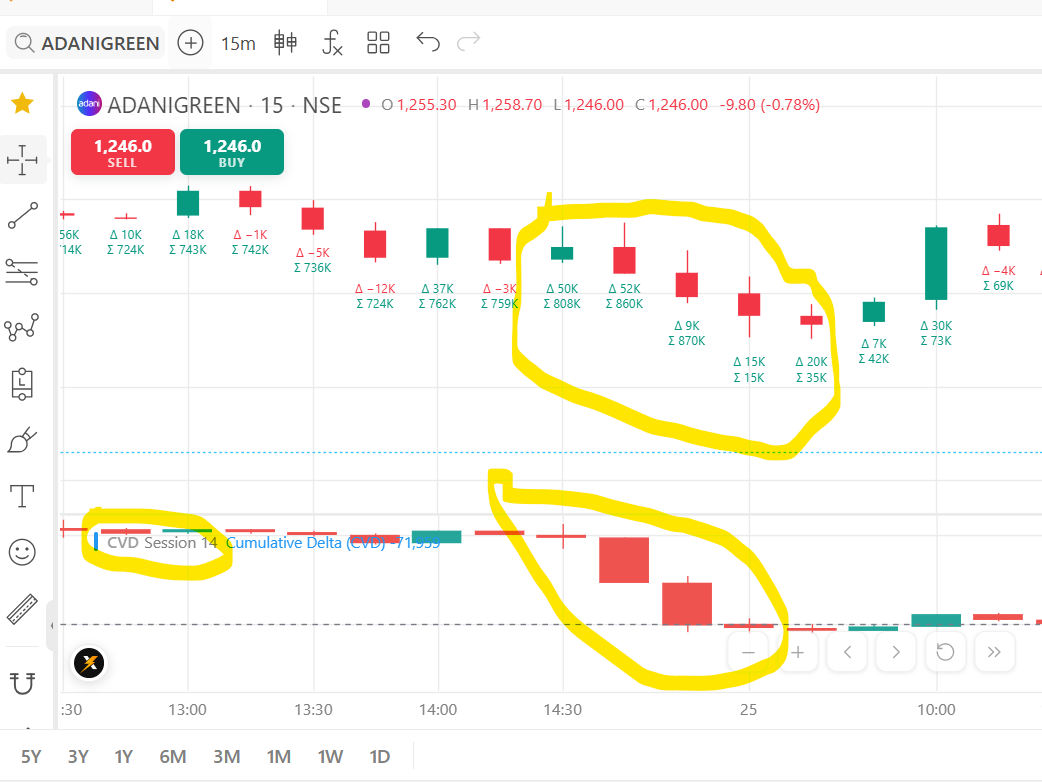
Delta is increasing and cumulative delta is also increasing, but in the cumulative delta pane the CVD bars are falling drastically. May I know which math/logic is being used here? I can’t make sense of it.
I would still advocate to bring back CVC pane from older version #15 which is easy to read and take less space vertically.