Dear Traders,
We built for Traders. And we continue to do so right from our initial days till now.
At Dhan, we have introduced a lot of innovations on charts from time to time, right from our early days to introducing Trading Directly on Charts, to bringing in trading tools like Scalper, or innovations like Trade Plan to much recent ones like Order Flow Charts on Dhan.
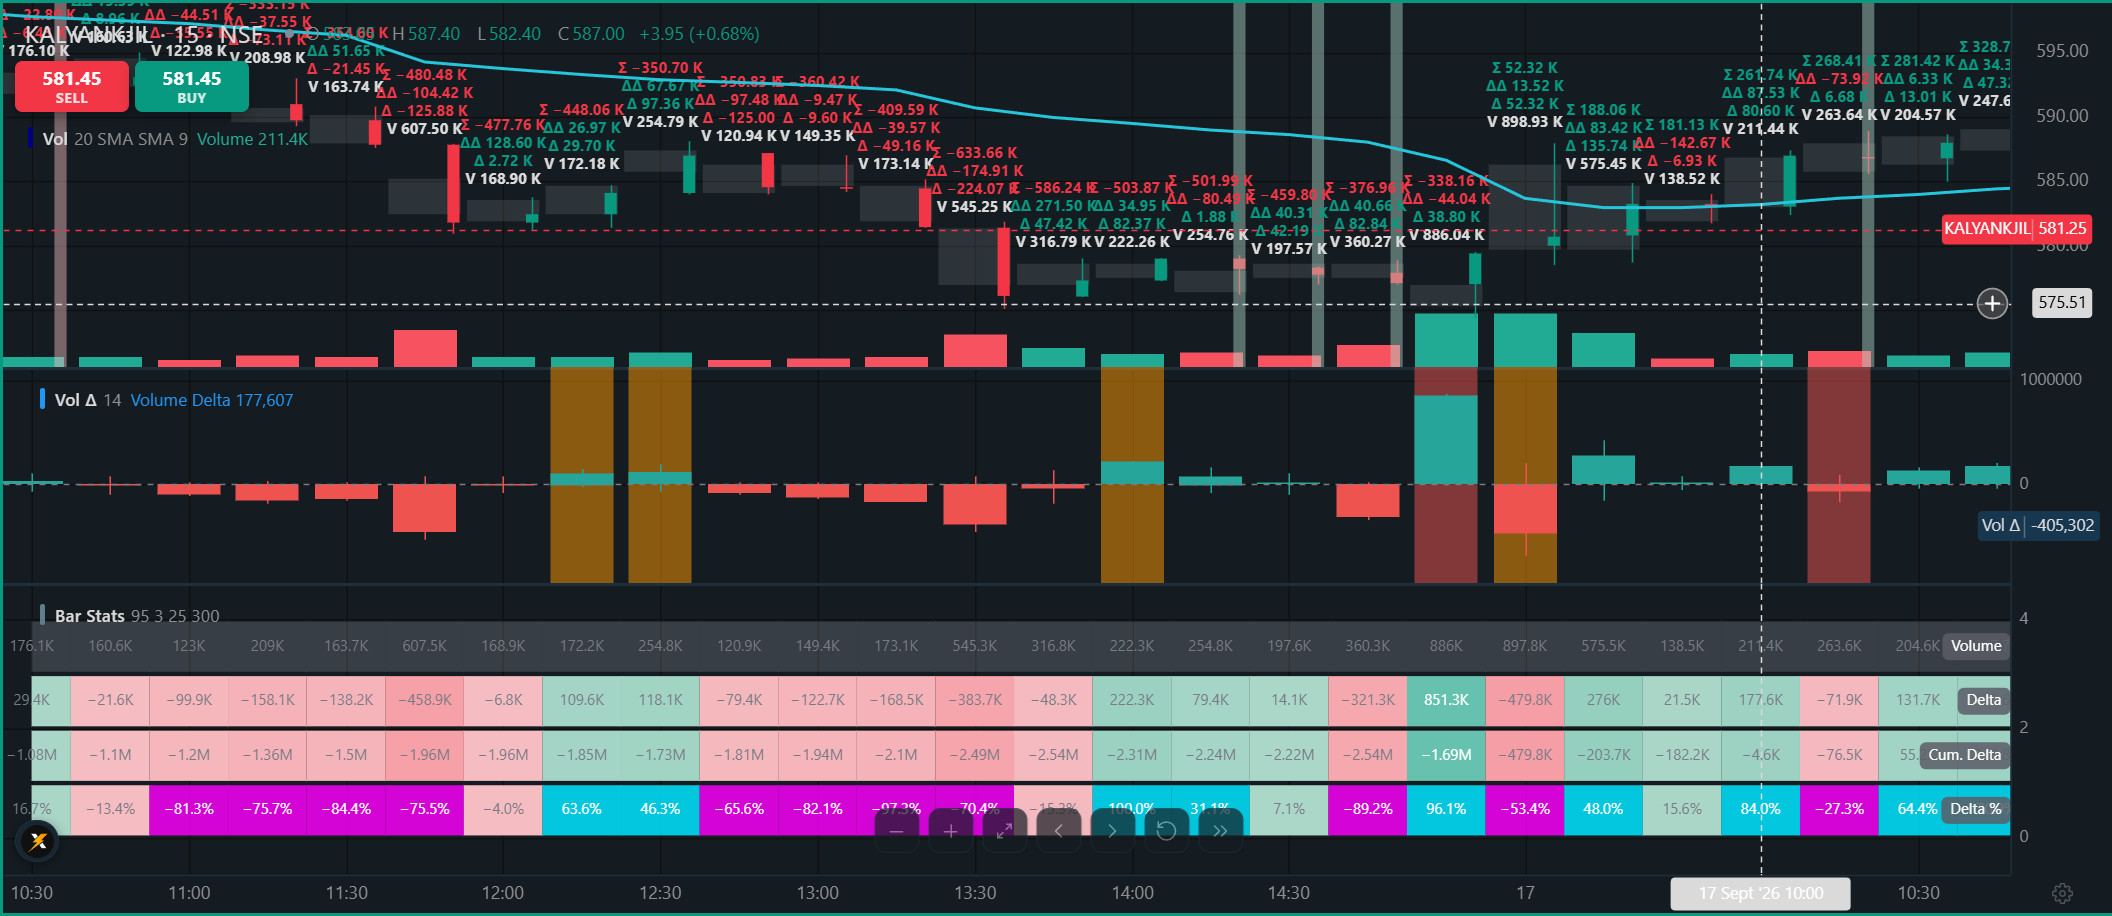
Price shows you where the market moved. It doesn’t show you what happened behind that move - who was building, where participation concentrated, or how buying and selling pressure shifted along the way.
We’ve been listening too - you told us you wanted more control over how Order Flow looks, more indicators and overlays to layer alongside it, deeper historical data, and support across every timeframe you trade on. Yes, we have got all of you for that!
Dhan Order Flow just got more granular, and more yours to shape.
Introducing: All new Order Flow Charts - A Fresh, More Granular Look
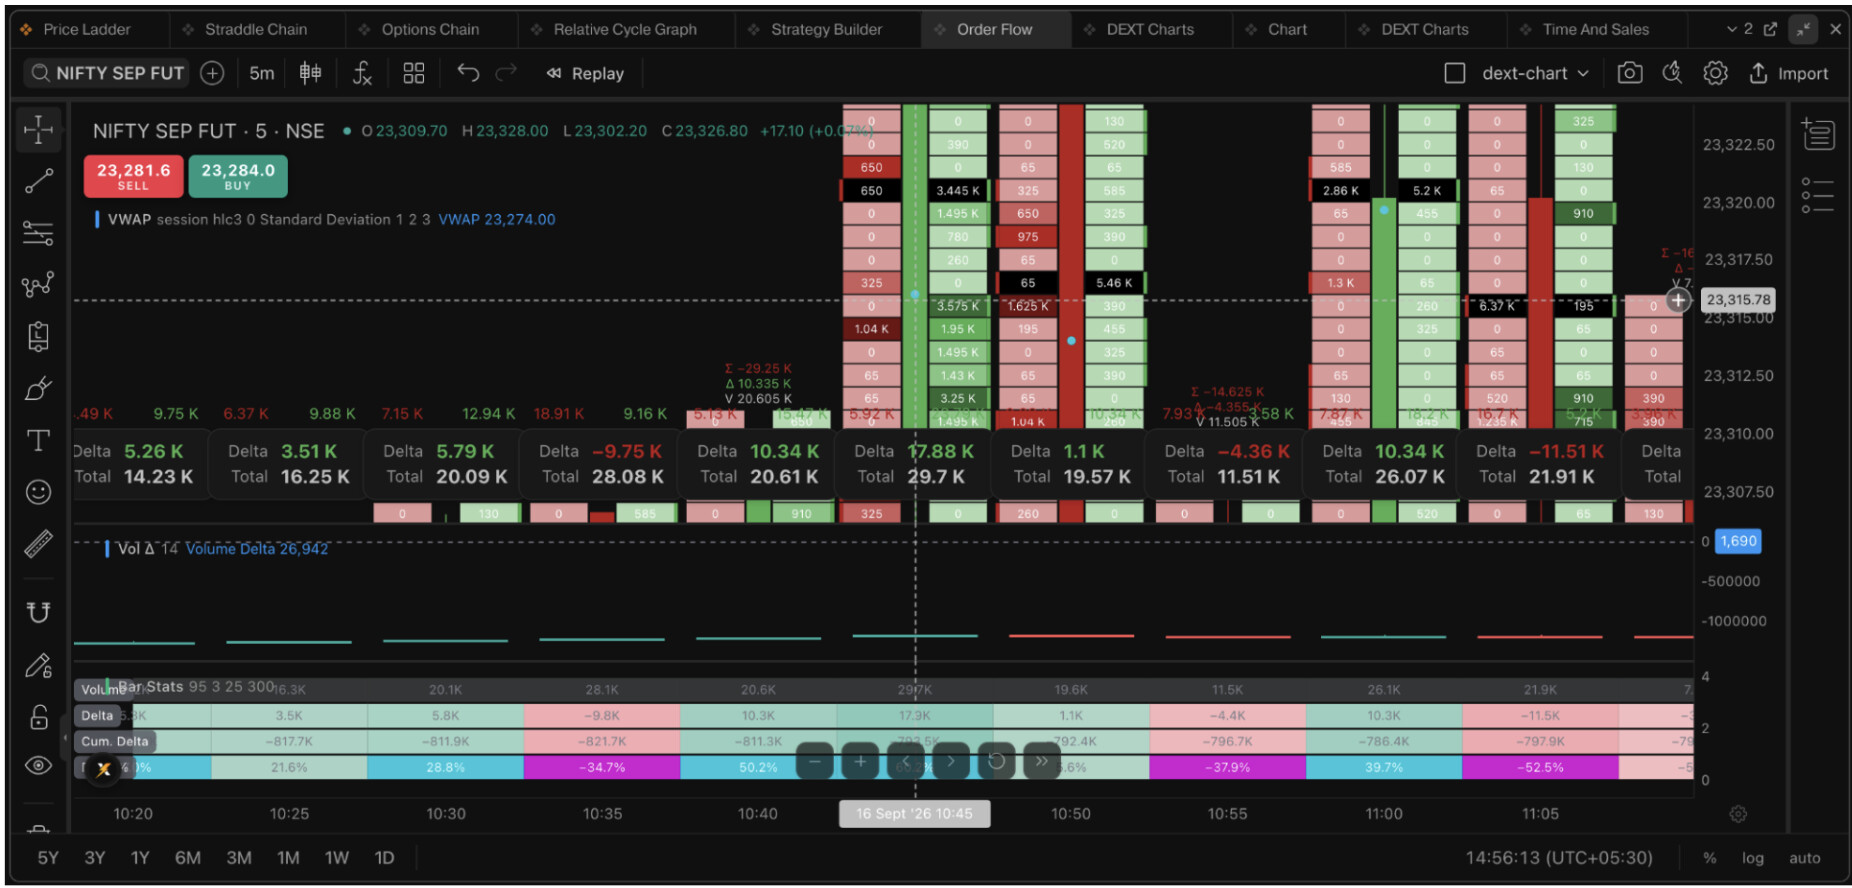
What’s Improved on Order Flow Charts
More Granular Market Activity
The enhanced Dhan Order Flow now captures a more detailed view of market activity across price and tick levels. You get more visibility into:
-
How activity develops across individual price levels
-
Where participation starts building
-
Where activity becomes concentrated
-
How buying and selling pressure changes as price moves
Improved Order Flow Plotting
We’ve also improved how buying and selling activity is represented across the footprint. This gives you more context when analysing:
-
A price move with strong participation behind it
-
Changes in buying or selling pressure during a move
-
Increased activity around specific price levels
-
Situations where price and participation behave differently
**
Historical Order Flow Is Now Available**
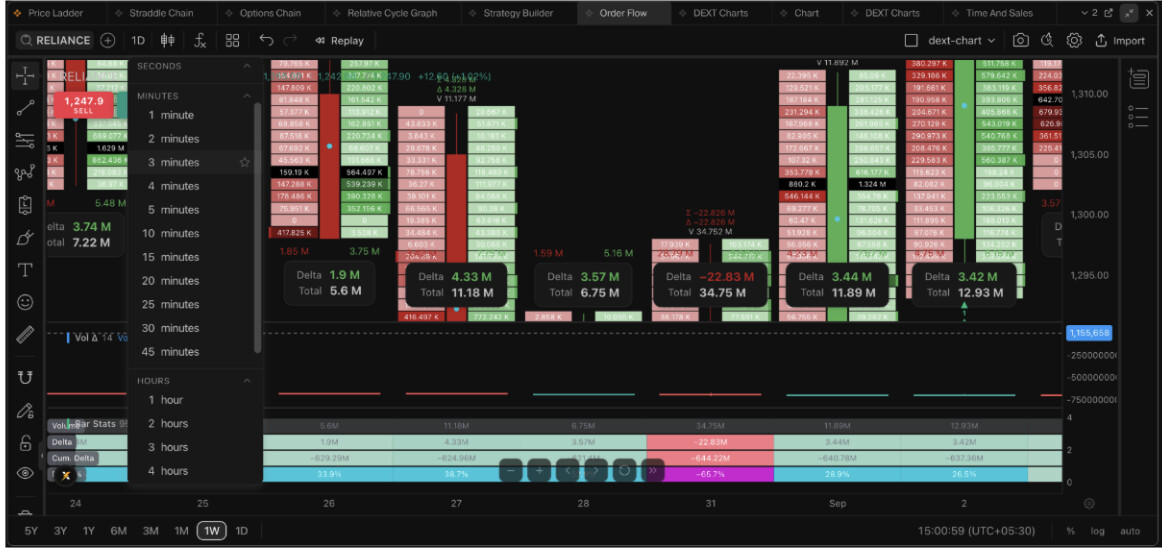
Order Flow is no longer limited to what’s happening in the current market. With historical Order Flow data, you can go back and study previous market activity - revisit price movements, examine participation across levels, and analyse how buying and selling activity developed during earlier sessions.
Order Flow history is now available across all timeframes, going back to 1st September for F&O and 1st August for stocks.
This makes the footprint useful not only for live market observation, but also for reviewing and studying past market behaviour.
The Bigger Upgrade
This isn’t simply about showing more data.
It’s about giving you a more granular and meaningful lens into market activity - both as it happens and when you look back at it.
More detail across price levels. More visibility into participation. More context behind price movement. And now, the ability to shape exactly how all of it looks.
Now Fully Configurable - Here’s Everything You Can Set
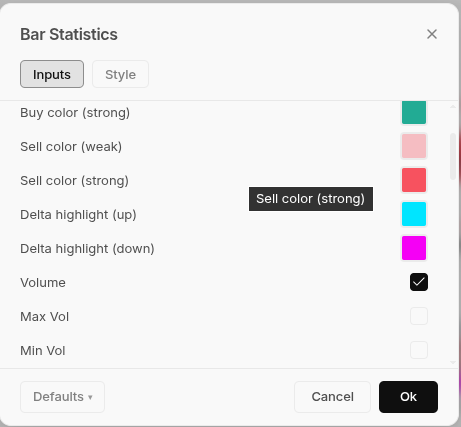
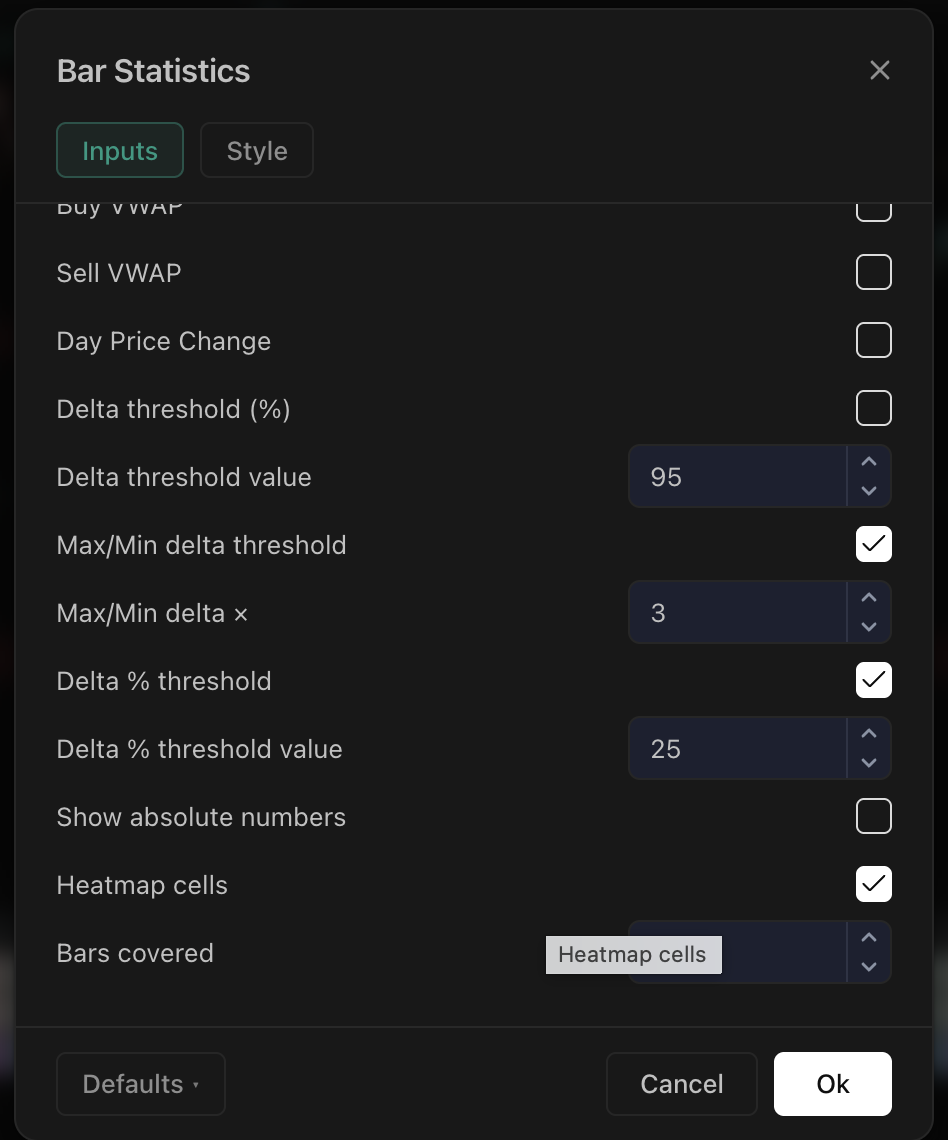
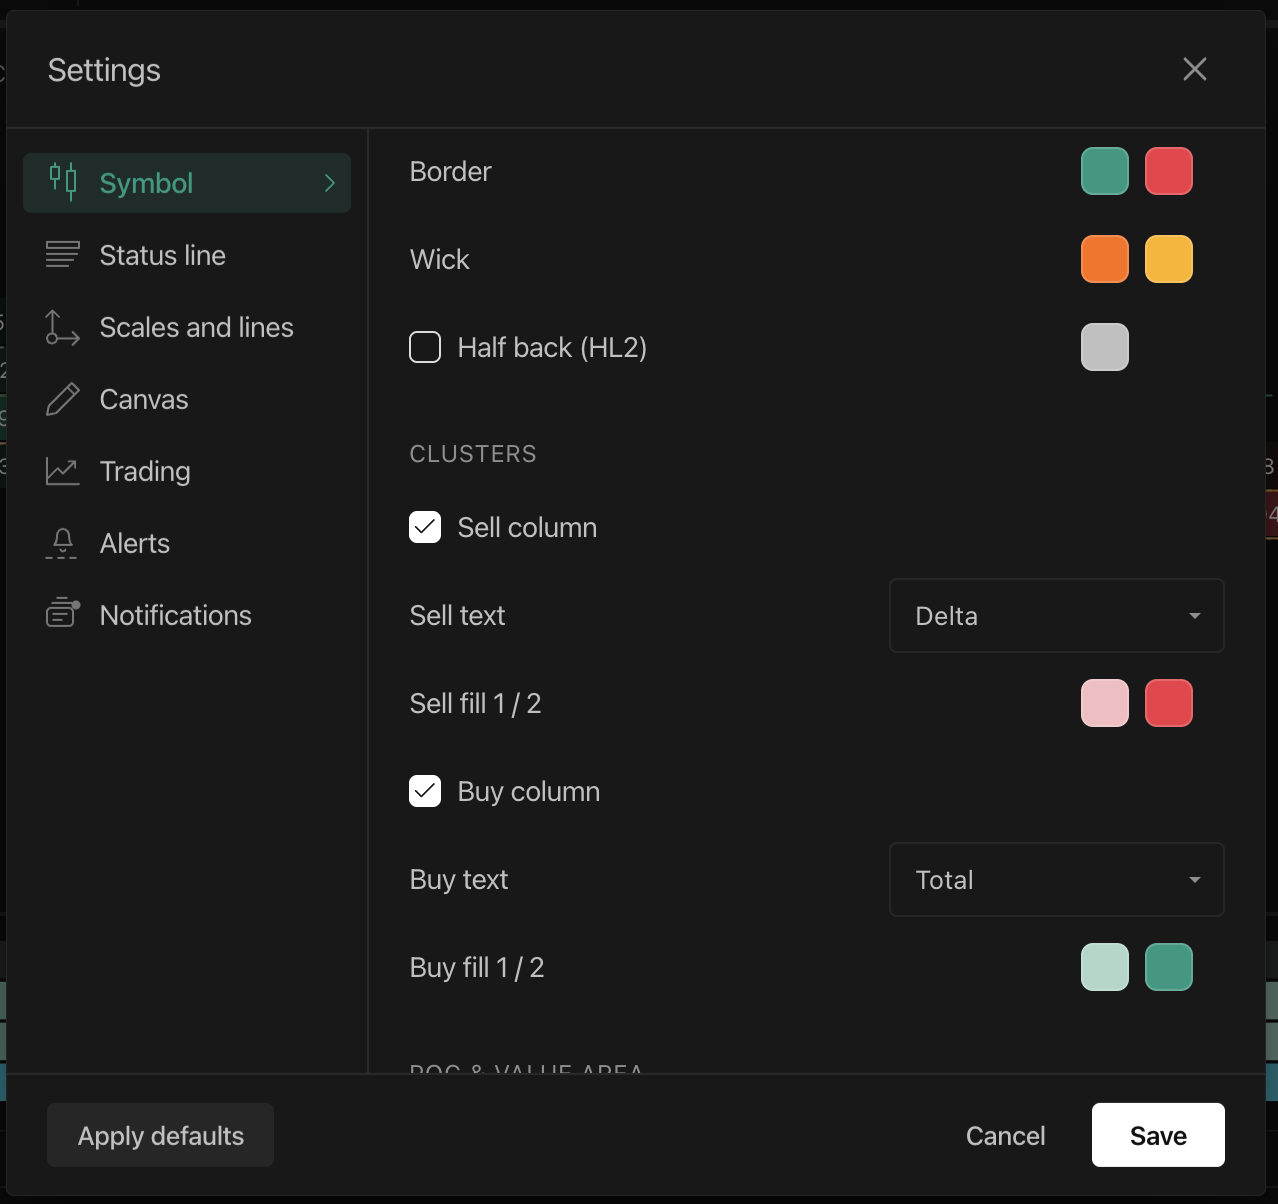
Order Flow now comes with a complete settings panel - every color, every cell, every layer of structure is yours to configure. Nothing here is mandatory - most of it stays off until you turn it on, so your chart stays exactly as clean as you want it. Here’s what it includes, what each piece actually tells you, and how it plays out in practice.
Cell Display & Colors on DEXT T3
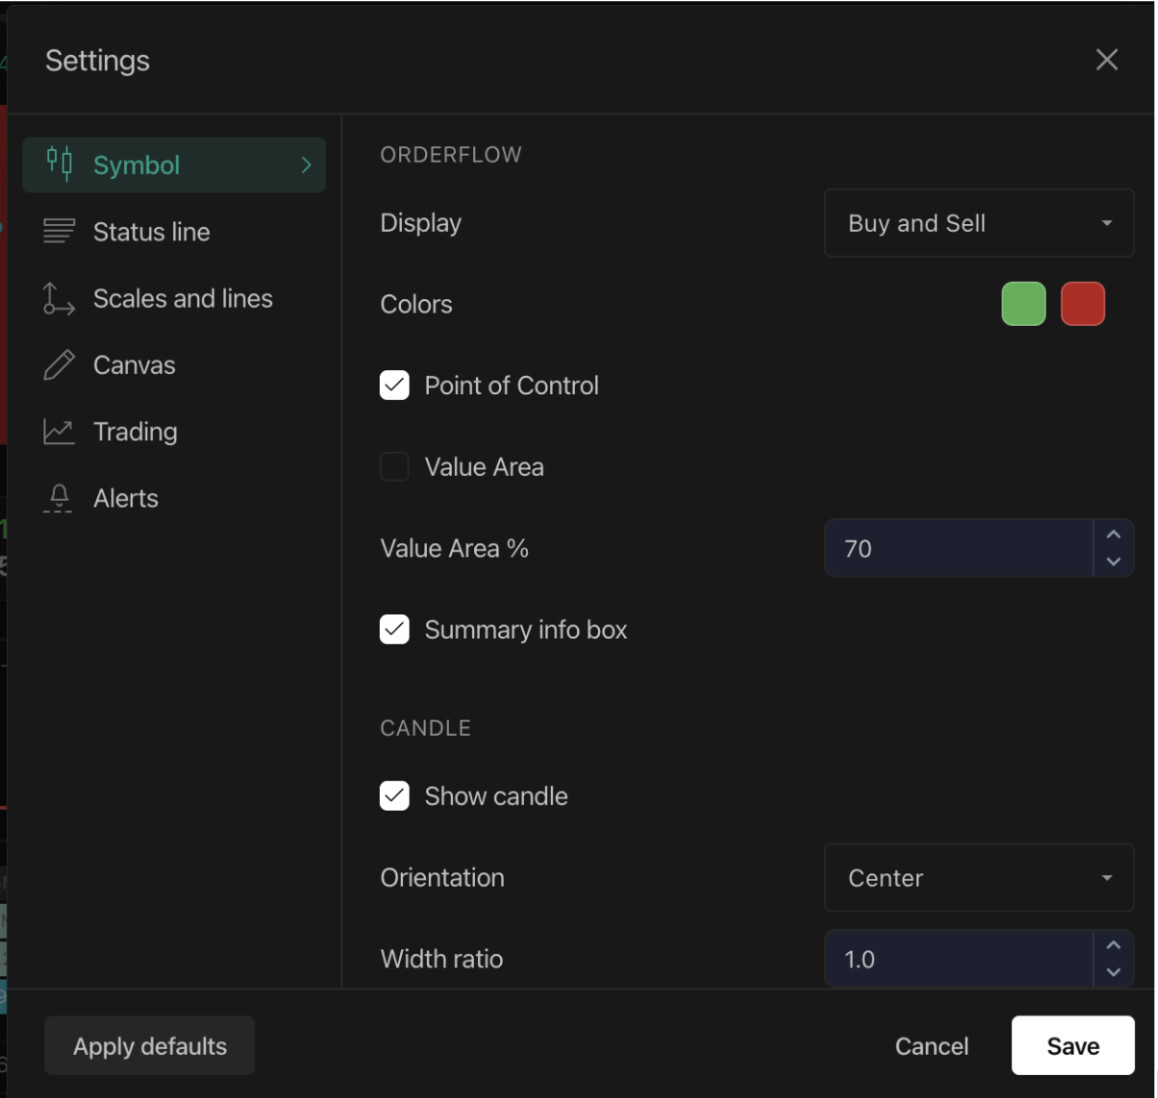
This is the buy/sell volume profile at its core - the actual aggressive buying and selling that happened at each price inside a candle, not a smoothed indicator.
-
Display: show Buy and Sell volume side by side, Delta as one net number per row, or Total volume in a single cell - Total is simply that row’s own combined volume, not a running or cumulative figure, so it will naturally differ from bar to bar
-
Colors: set your own base up/down colors
-
Cluster fill gradients: shade cells from weak to strong on both the buy and sell side, so the heaviest activity pulls your eye immediately instead of you scanning numbers to find it
Example: switch Display to Delta if you’d rather see one net number per row instead of two separate ladders - useful when you’re scanning several strikes quickly and just want the net story at each level.
Delta, Cumulative Delta & Divergence on DEXT T3
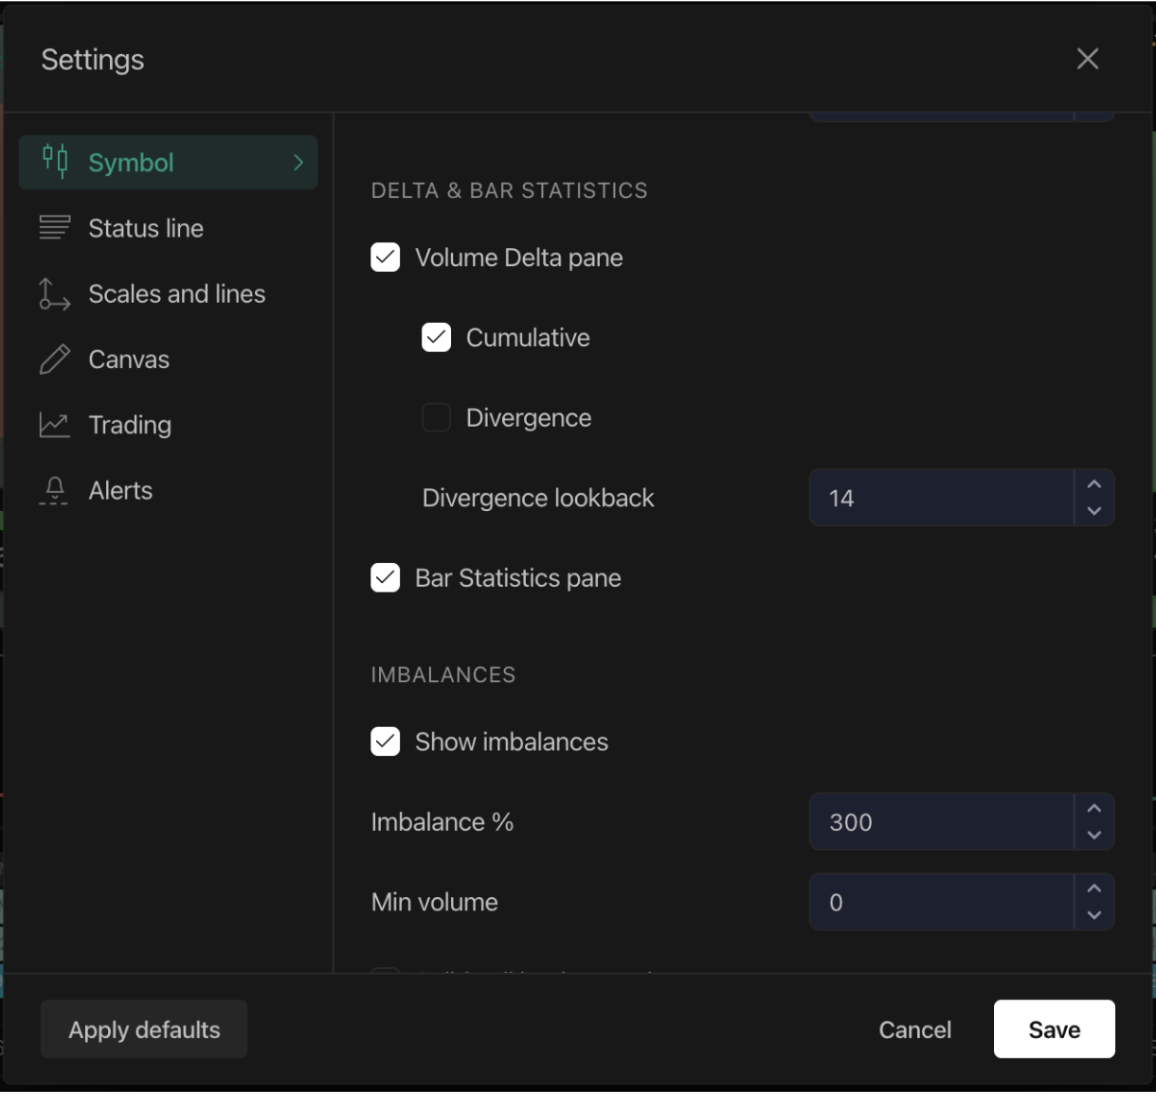
Delta is the net score of a candle - total aggressive buy volume minus total aggressive sell volume. Positive means buyers were more aggressive overall, negative means sellers were, regardless of which way price closed.
-
Cumulative Delta now runs in a dedicated Volume Delta pane, tracking that buying or selling pressure across the whole session. Want it directly on the candle instead? Turn on the Cumulative Delta marker under Markers, and it prints right above the ladder - no need to open a separate pane
-
Delta Divergence flags when price and delta tell two different stories - a candle closes higher but delta is negative, or closes lower but delta is positive. That mismatch is worth watching closely before committing to a position
-
Divergence detection now has an adjustable lookback, and bullish/bearish shading you can color independently, flagged directly on the candle
Example: on a scrip testing a prior high, Delta Divergence flags it if the candle closes higher while delta is negative - a mismatch worth watching before reading the move as fully backed by demand.
POC & Value Area on DEXT T3
-
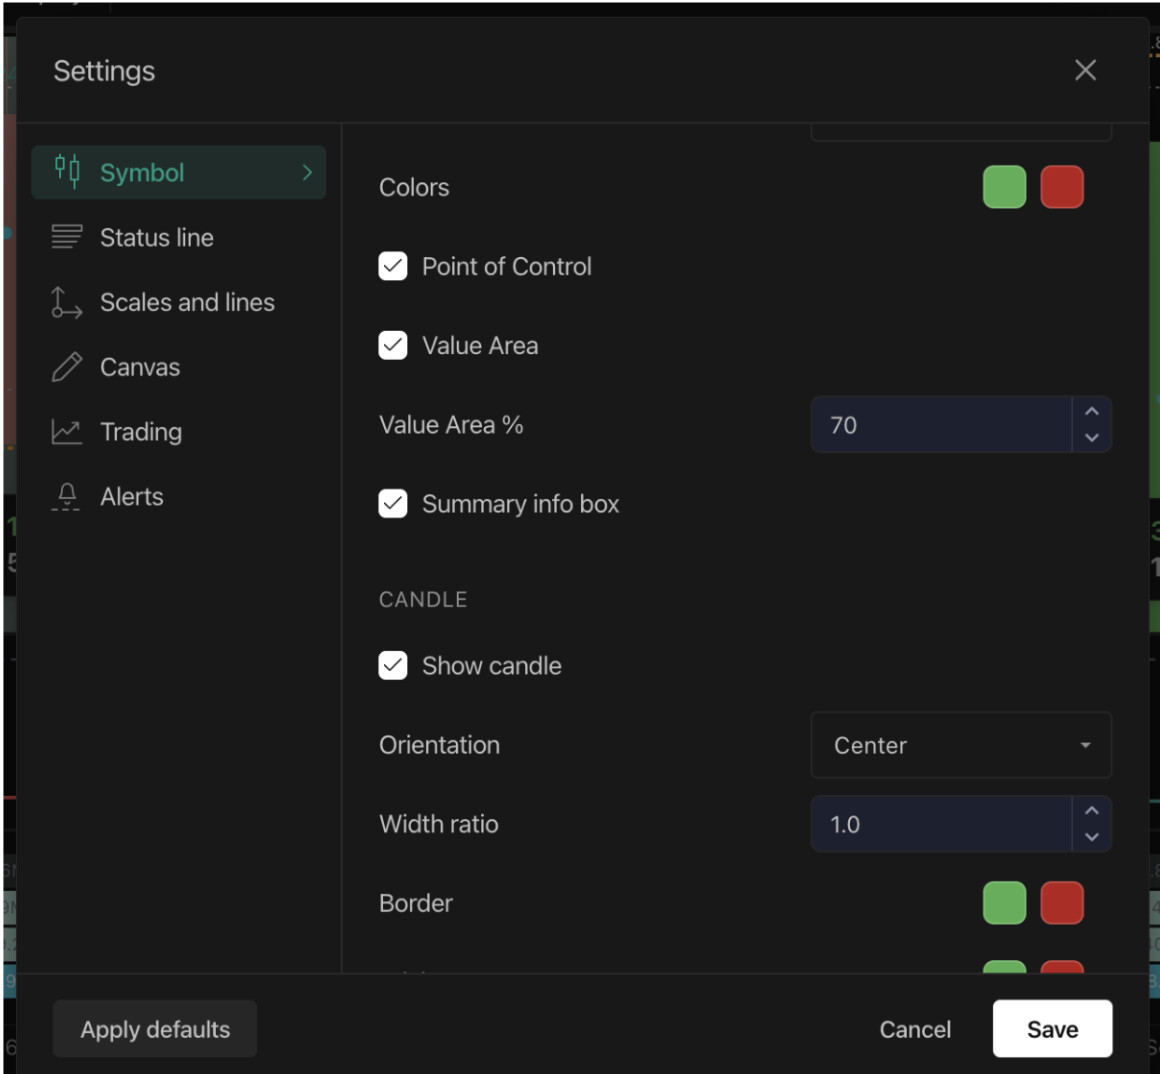
POC (Point of Control) - the single price level inside a bar where the most volume traded, where both sides agreed the most. Now highlighted on every bar, and you can extend it as a line across the chart so a POC that hasn’t been revisited stays visible as an untested level
-
Value Area - the price range holding a set percentage of the bar’s total volume (70% by default) - the zone of real consensus. VAH (Value Area High) and VAL (Value Area Low) are its upper and lower edges
-
Shade the full VAH-to-VAL band so the zone reads as one continuous area instead of two lines you connect mentally
-
Tighten or widen the Value Area percentage, and color the band as one solid shade or split by whether the bar closed up or down
Example: turn on Extend POC Line on a level that hasn’t been revisited in a few sessions, and you’ll see it project forward - a visual cue that price hasn’t yet come back to test it.
Clusters & Imbalances on DEXT T3
-
Turn the sell or buy ladder on or off independently, and choose what each side prints - volume, delta, or total
-
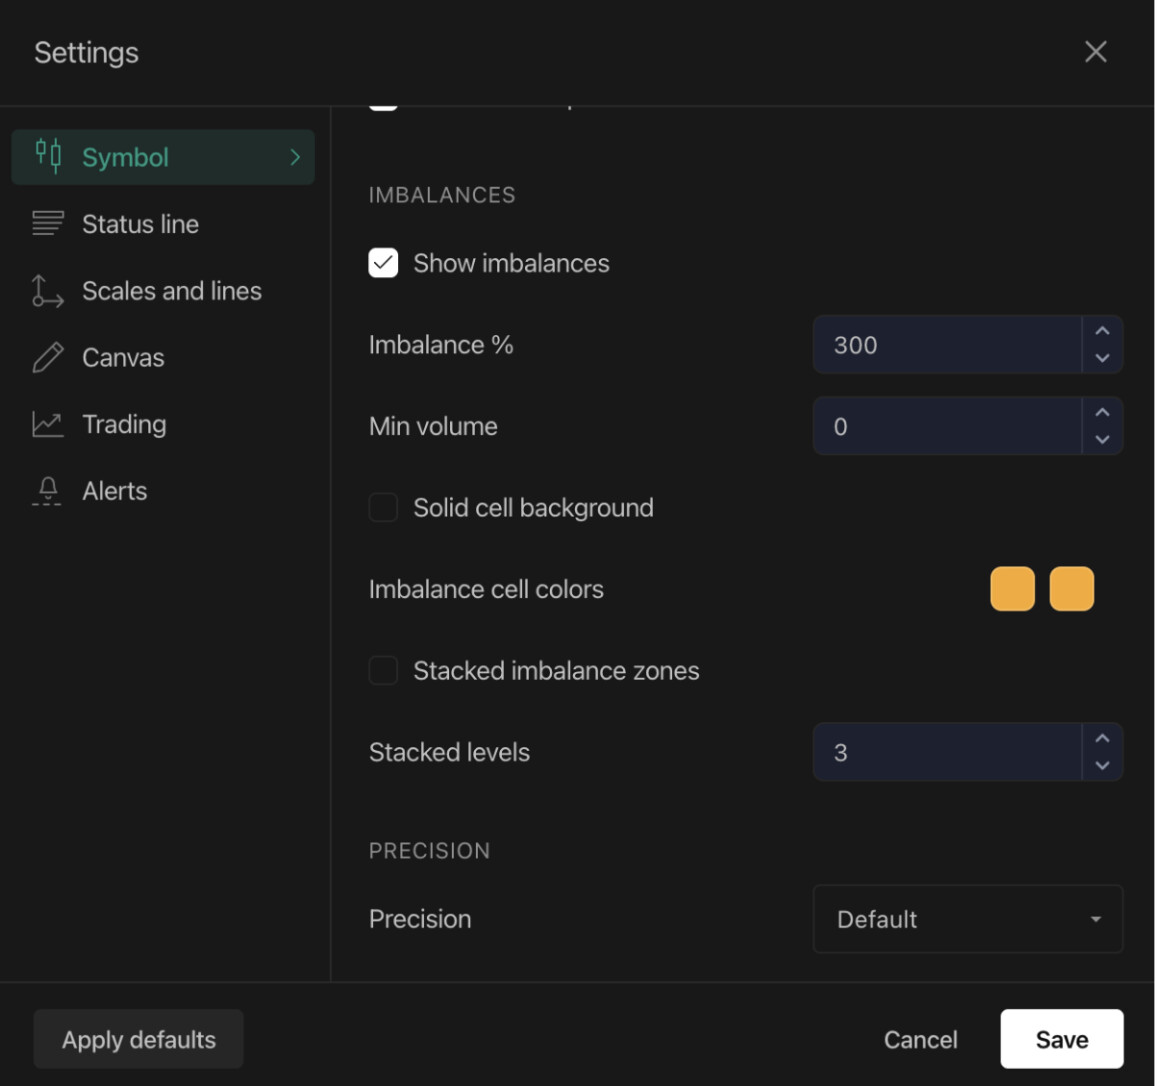
Imbalances flag a price level where one side so heavily dominated the other that it signals aggressive, one-sided conviction - set your own dominance threshold, filter out thin levels with a minimum volume floor, and paint flagged cells solid instead of graded
-
Stacked imbalance zones - when several consecutive same-side imbalances stack up, that’s a level where the market ran out of opposition, and one that often acts as strong support or resistance on a revisit. You decide how many consecutive levels count as one
Example: set Stacked Levels to 3 with Imbalance % at 300, and a zone only lights up once three consecutive rows on the same side clear that dominance threshold - filtering out one-off noise.
Spotting Institutional Buying & Selling on DEXT T3
Large institutional participants rarely announce themselves with one big trade - they tend to build size gradually, price level by price level. Order Flow is built to make that footprint visible, since it reads actual executed trades rather than resting orders that can be placed and pulled in an instant.
A few patterns worth watching for:
-
Stacked imbalances at a level, session after session - when the same price keeps flagging as an imbalance zone across multiple sessions instead of fading away, it’s often size being worked in slowly rather than a one-off retail push
-
POC drifting in one direction, bar after bar - a Point of Control that steadily climbs or falls candle over candle, even through minor pullbacks, is a strong indication that bigger participants are building or unwinding a position rather than reacting to a single move
-
Heavy volume with a flat Value Area - session volume that’s unusually high while VAH and VAL barely shift often signals large orders being worked through quietly, without letting price run
-
High Volume Nodes that keep getting revisited - a price level that trades heavy volume repeatedly, session after session, on the Volume Profile tends to represent a zone large participants treat as fair value, and price often reacts strongly the next time it returns there
None of this replaces price action or your own setup - treat it as context, not a signal to act on by itself.
Overlays, Oscillators & Session Volume Profile on DEXT T3
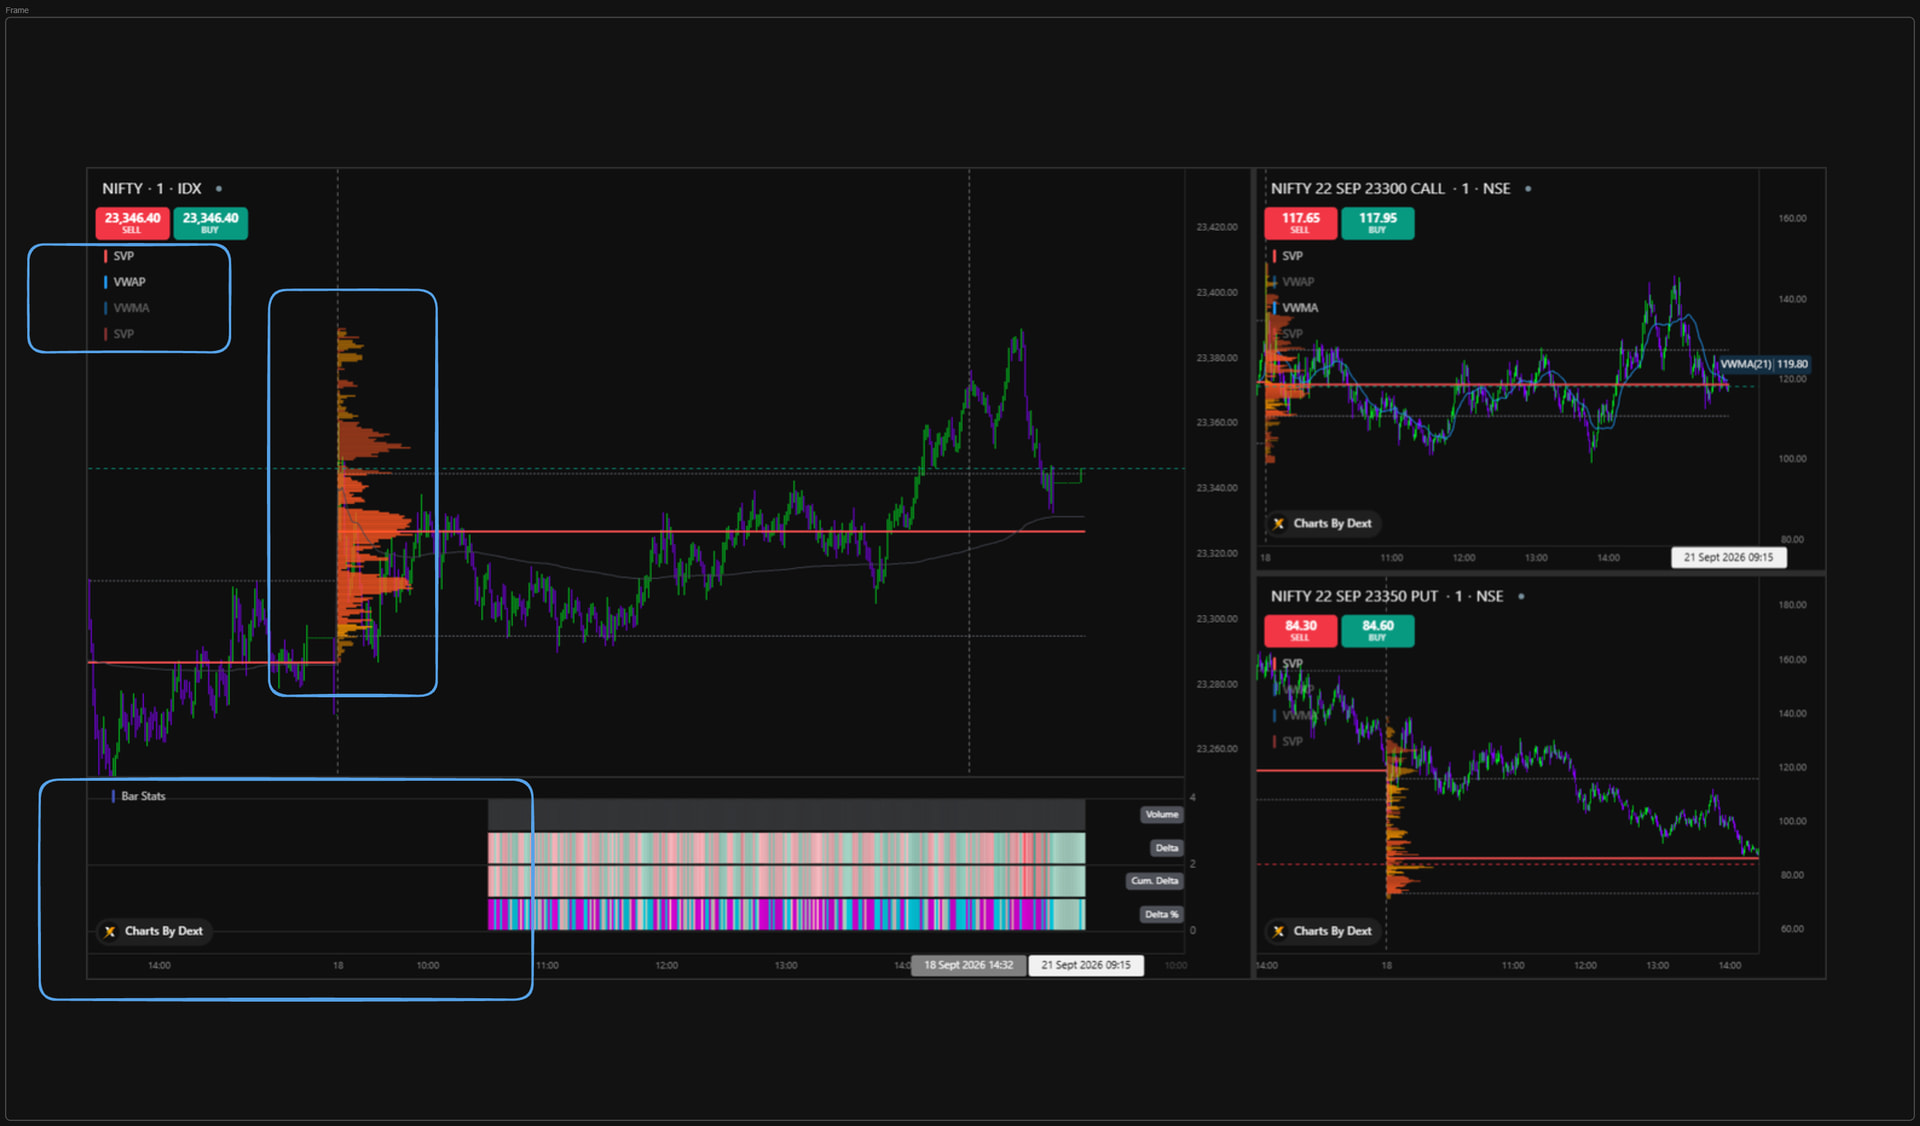
Order Flow charts now support any overlay or oscillator you’d normally add to a regular chart - layer your own indicators directly on the footprint
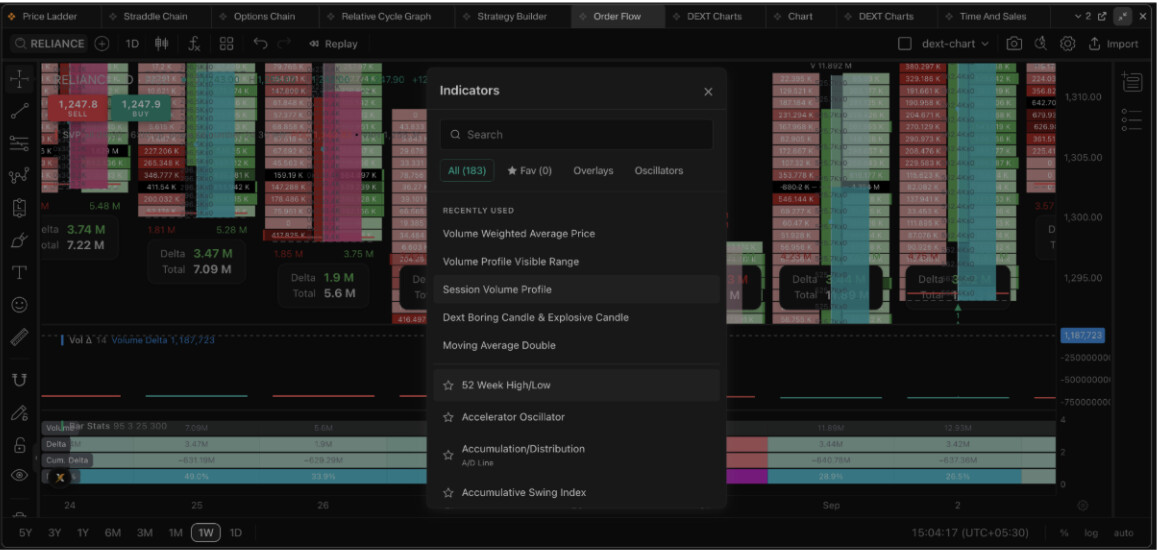
- Session Volume Profile is also live here - a session-wide view of volume at every price level, shown alongside the chart, so you can see where heavy trading built up across the whole session, not just inside individual candles
Example: layer an RSI or a moving average directly on the footprint instead of switching to a separate chart to check momentum.
Historical Depth & Data Granularity on DEXT T3
-
Order Flow history is now available across all timeframes - going back to 1st September for F&O and 1st August for stocks. You’re no longer limited to reading just the live session
-
Every calculation behind Order Flow - delta, imbalances, POC - now runs on deeper tick-level data than before, for a sharper, more accurate read of what actually traded at each price
Rows & Precision on DEXT T3
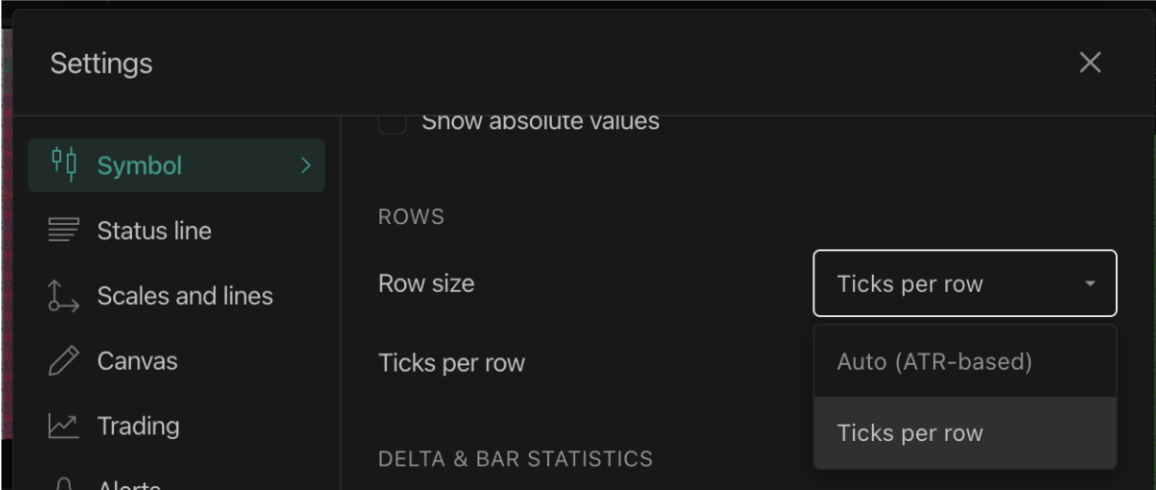
Row height isn’t locked to auto anymore - you get two ways to size it, and they solve different problems:
-
Auto (ATR-based): row height is calculated automatically as a fraction of the Average True Range (ATR) over a length you set. As volatility rises, rows widen to keep the ladder readable; as volatility contracts, rows narrow to add resolution. This adjusts on its own as market conditions change, so you’re not manually resizing every time volatility shifts. The ATR Length setting controls the lookback - longer lengths give steadier, less reactive row heights across bars.
-
Ticks per row: you set a fixed number of ticks per row yourself, and it stays fixed regardless of volatility. Fewer ticks per row shows finer price detail across more rows; more ticks per row merges levels into fewer, heavier cells. Useful when you want a consistent, predictable ladder - say, comparing the same setup across different days - rather than one that reshapes itself with volatility. If Auto mode is showing fewer blocks per candle than you’re used to, that’s usually the default 14-length ATR producing wider rows - switch to Ticks per row for a more granular ladder
-
Price precision on the scale is adjustable too
Example: on a fast-moving index, switch from Auto to Ticks per row and set it low for a finer ladder than the default ATR-based sizing gives you.
Unfinished Auctions on DEXT T3
An unfinished auction is when the highest or lowest price level of a bar traded on both sides - meaning the market didn’t fully settle the auction at that extreme before the bar closed. These are flagged with a dashed tick beyond the bar’s high or low, and price tends to revisit these levels to finish the business that was left open.
Example: a dashed tick beyond the day’s low often gets revisited within the next few sessions, as the market comes back to finish what wasn’t settled.
How to Get Started
Order Flow is live on DEXT T3 at dext.dhan.co. Open the Order Flow widget, head into settings, and start shaping it around exactly how you trade.
Like many features on Dhan, this one was shaped by suggestions from the community. Do let us know how it’s helping you and what more we could add.
Happy Trading!
Bhavya