Hello Traders! 
At Dhan, every feature we build for DEXT T3 starts with one question - what information gap is quietly costing traders edge every single day? For intraday traders, one gap has always stood out. Price tells you where the market went. It has never told you why - who was actually driving the move, who was absorbing it, whether it was the buyers or the sellers, and whether the conviction behind it was real.
That gap ends today.
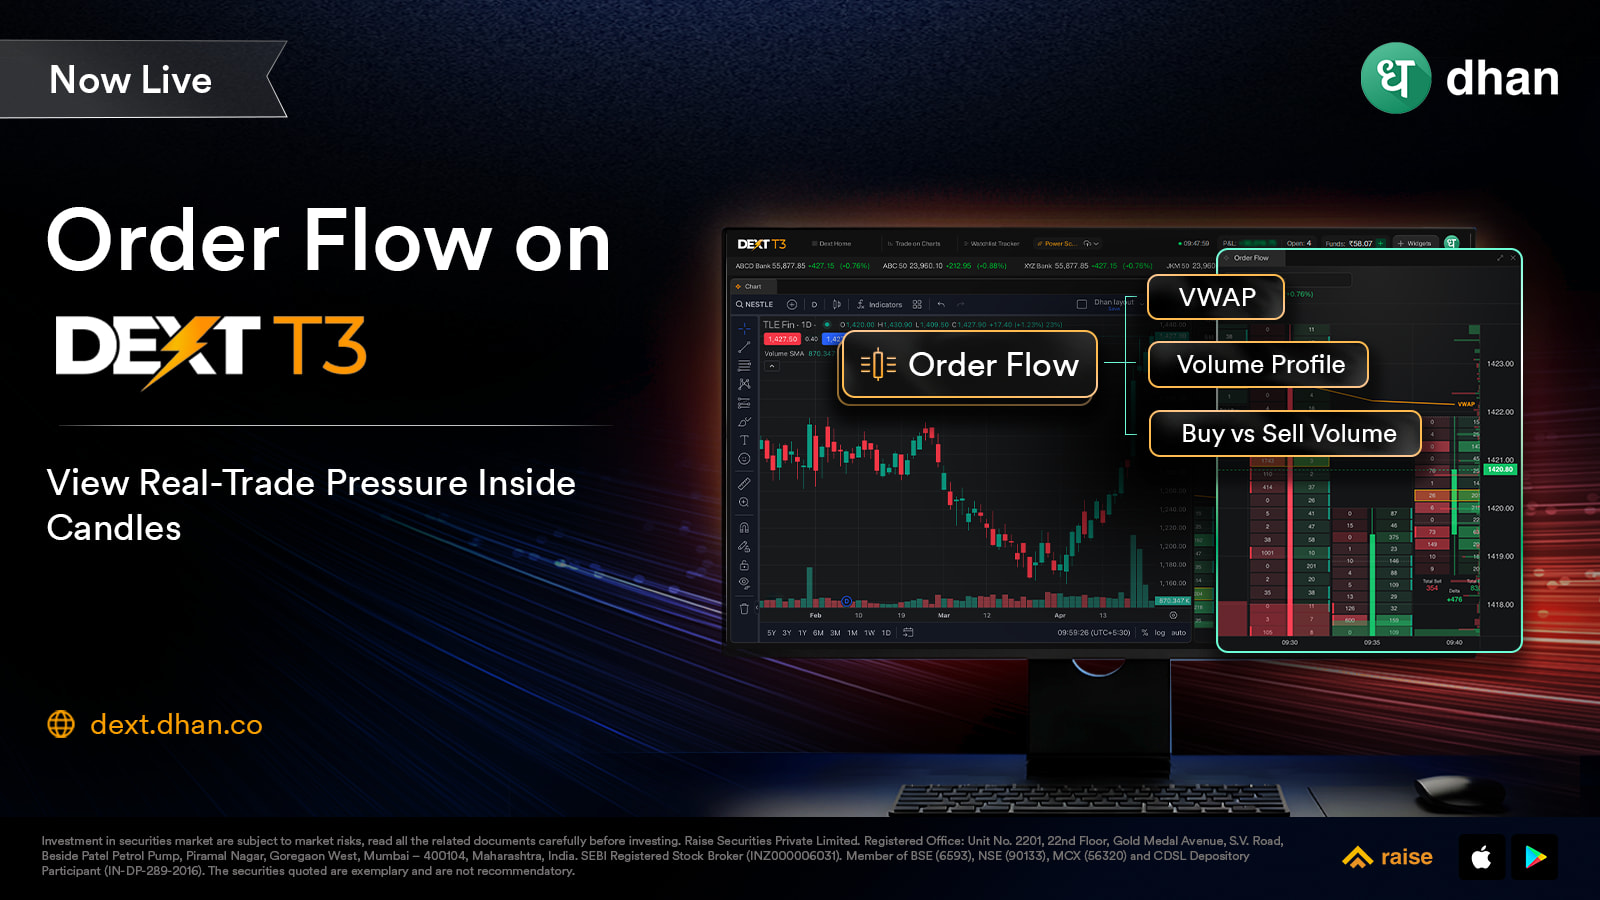
Introducing: Order Flow on DEXT T3 - available for the first time on any Dhan platform.
The Problem Worth Solving
Let’s say you’re watching Futures of a scrip on a 3-minute chart. A strong green candle forms. Price moves up 80 points. Your setup says you should enter with a long (or buy) position.
And then it reverses. Hard.
What happened?
The candle looked bullish. The move looked real. But what you couldn’t see was what was happening inside that candle. The buying was thin and unconvincing. Sellers were absorbing every bid aggressively at the highs. The volume was there — but it was the wrong kind, going in the wrong direction.
This is the gap that kills intraday trades. Not your analysis. Not your setup. But the invisible battle between buyers and sellers playing out inside every single candle — a battle that standard charts simply never show you.
Every candle on a regular chart tells you four things: open, high, low, close. It tells you the result of the fight. It doesn’t show you how the fight was fought — who had control at each price level, where aggressive buyers stepped in, where sellers defended hard, where the real absorption happened.
How Order Flow on DEXT T3 Solves It
Let’s go back to that same Futures candle.
It’s 10:45 AM. Futures on this chart are approaching a key resistance at 23,800. A strong green candle pushes right into that level. Every other trader on a regular chart sees a bullish candle and thinks breakout.
You have the Order Flow widget open on DEXT T3 - sitting right alongside your chart in your workspace.
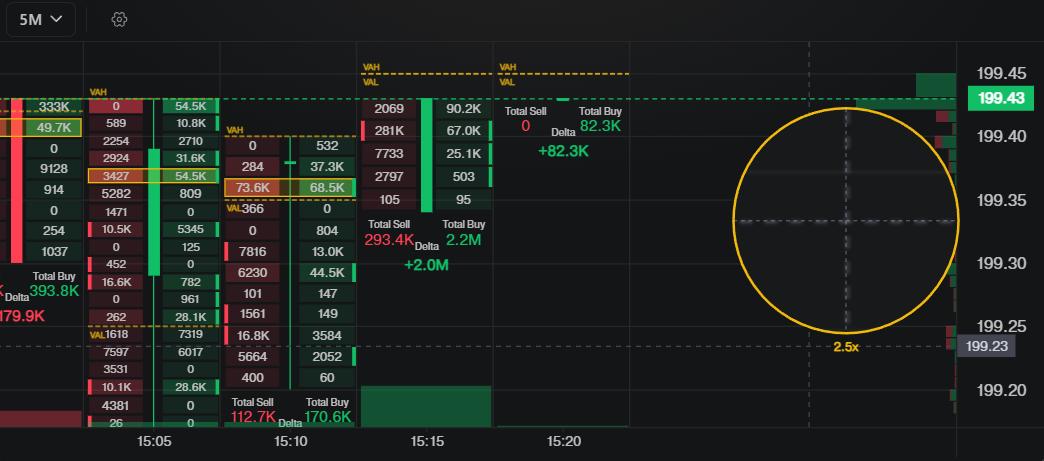
Inside that candle, Order Flow is showing you something a regular chart never could. At 23,795 and 23,800 — the price levels right at resistance - real sell volume is dominating the buy volume. Sellers are not just showing up. They are transacting aggressively at those levels. And the delta — the net score of the entire candle - is deeply negative. Sellers won this candle convincingly in actual executed volume, even though price closed near the high.
This candle isn’t a breakout. It’s a trap.
You don’t buy. You wait. Price reverses sharply within two candles.
This is what Order Flow gives you — the real story inside every candle, before you make your decision.
Here’s exactly what you can see:
What You Can See - The Basics
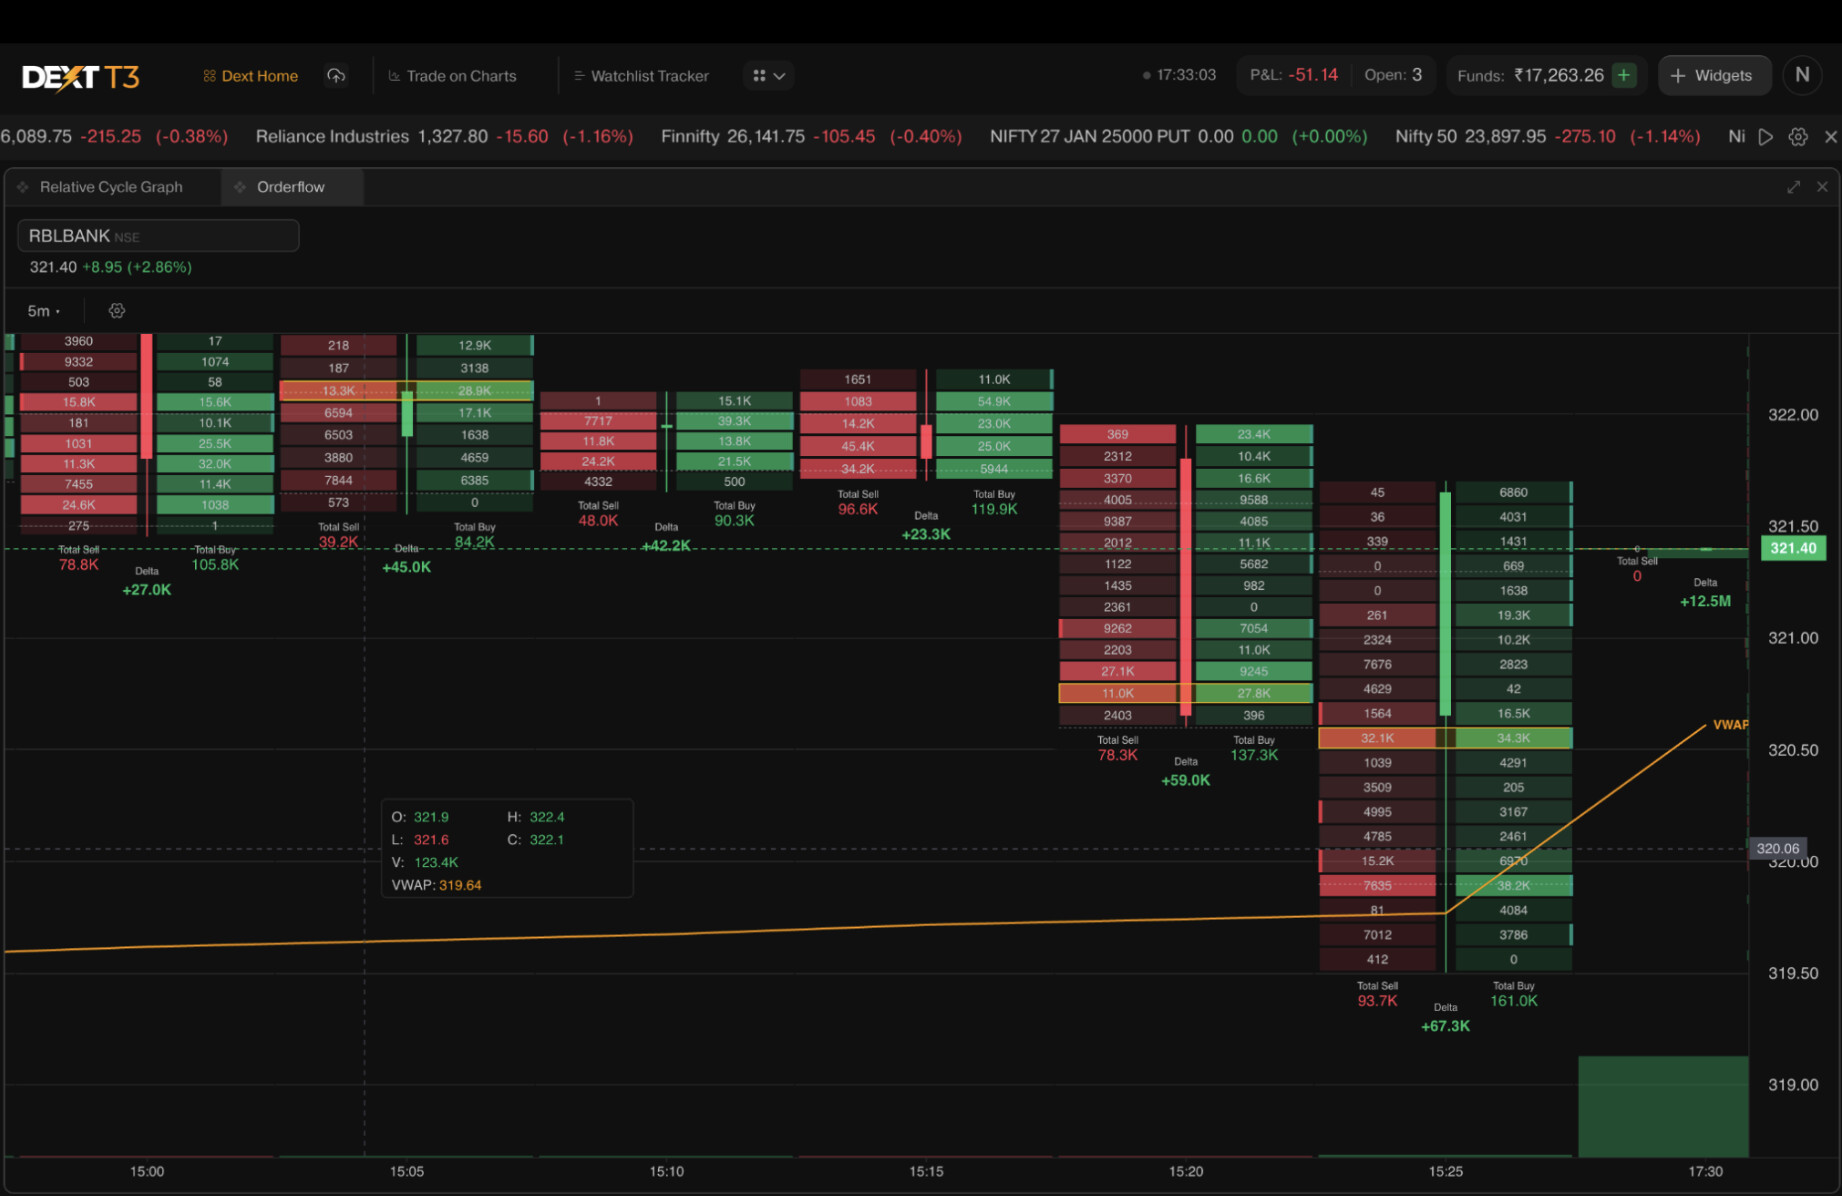
→ Buy vs. Sell Volume at Every Price Level Inside the Candle
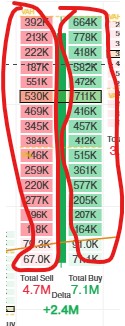
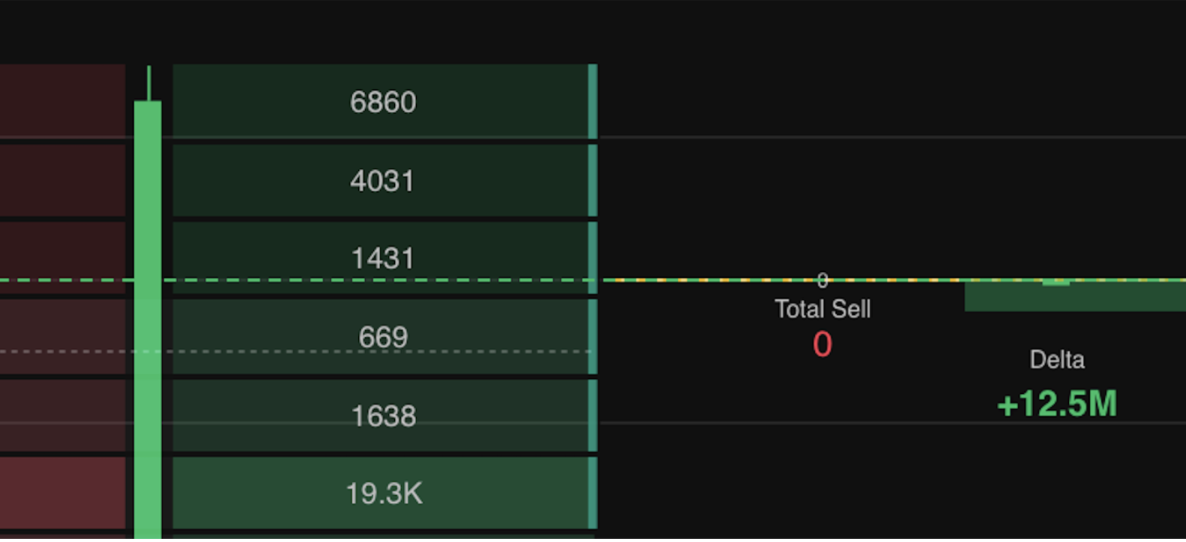
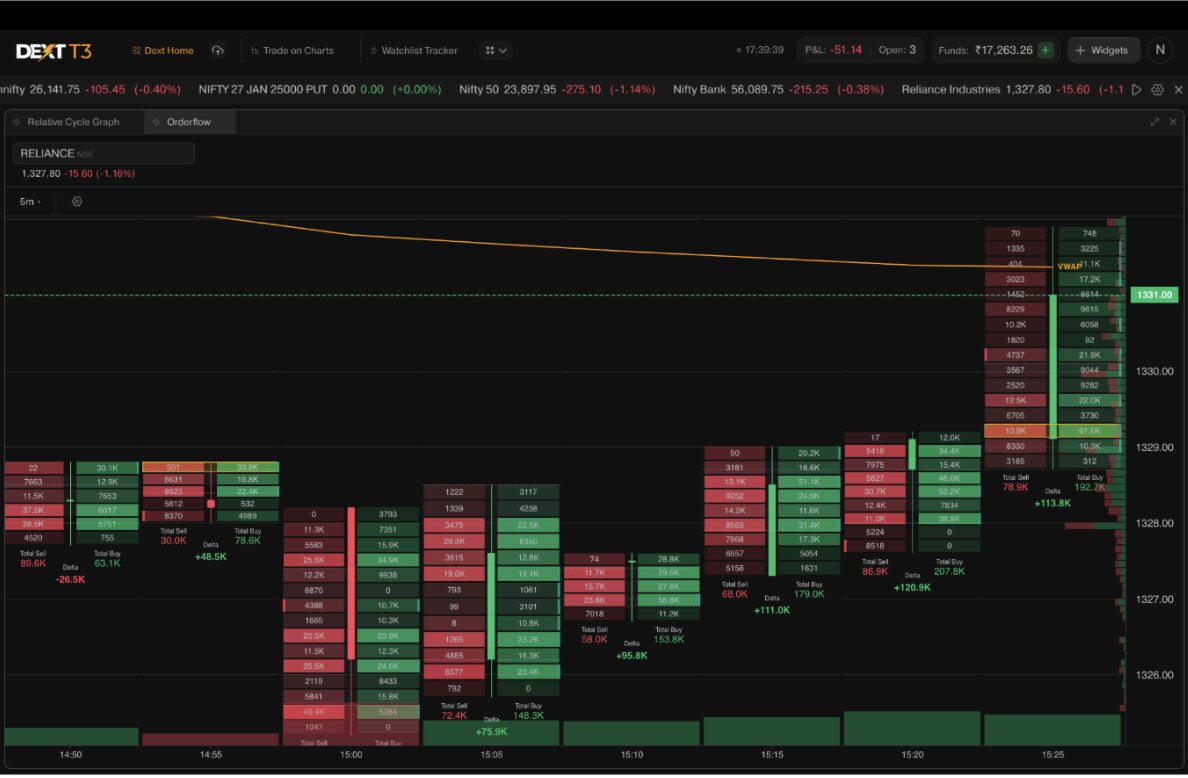
At every price level inside each candle, Order Flow shows you how much aggressive buying and how much aggressive selling actually happened — side by side. Not a smoothed indicator. Not a lagging signal. Real data, price by price, candle by candle.
A candle that looks identical from the outside can tell two completely different stories on Order Flow — depending on where the real buy and sell pressure actually sat inside it. Now you see both stories, not just the one the close is telling you.
*The securities are quoted as an example and not as a recommendation.
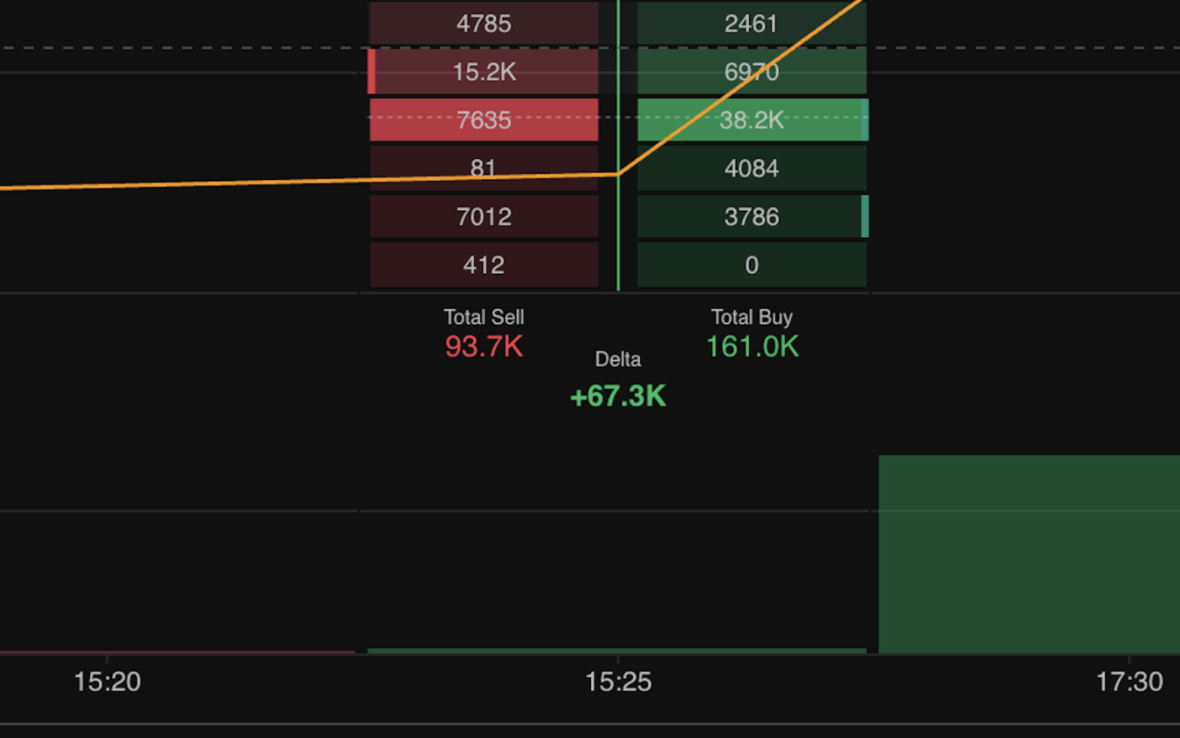
→ Delta - The Net Battle Score of Every Candle
Delta is the difference between total aggressive buy volume and total aggressive sell volume for the entire candle. One number. The complete verdict of who actually won.
Positive delta - buyers were more aggressive overall. Negative delta — sellers dominated.
Here’s what makes delta so powerful: a candle can close green with a deeply negative delta. Price moved up - but sellers were more aggressive in actual volume throughout. That divergence between bullish price and bearish delta is a strong indication of potential weakness - worth watching closely before committing to a position.
Without Order Flow, you’d never see it. With it, it’s right there on every candle.
What You Can See - Going Deeper
Once you’re reading the basics, Order Flow on DEXT T3 gives you a second layer of tools that take your market reads even further.
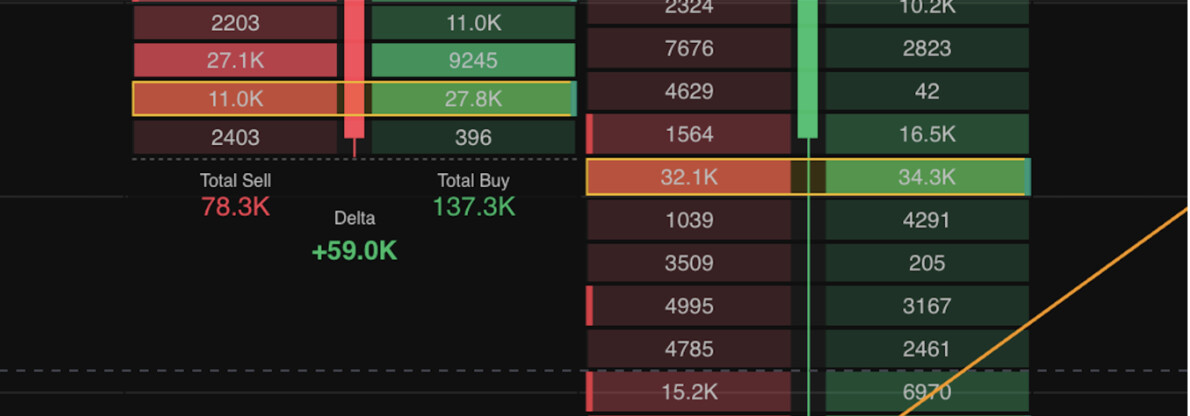
→ Point of Control (POC)
The price level inside each candle where the most total volume was traded — where the most business actually got done, regardless of where the candle opened or closed. The POC is highlighted visually on every candle so you can spot it instantly.
Why it matters: the POC is where both sides agreed the most. Price has a tendency to gravitate back towards it. A POC shifting higher candle over candle confirms a strengthening trend. A POC sitting at the lows of a bullish candle tells you the conviction behind the move was weaker than the close suggests.
→ Value Area (VAH & VAL)
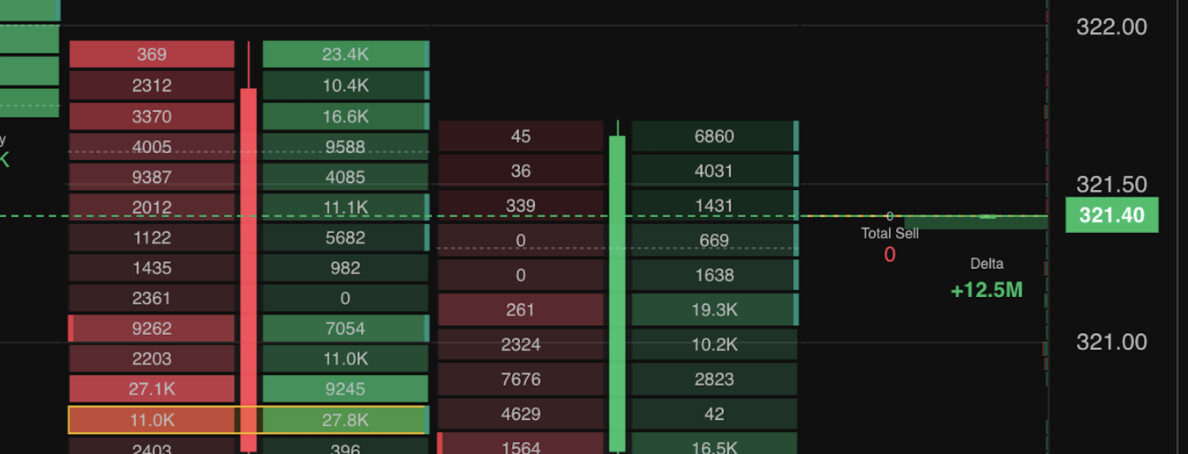
The price range where 70% of a candle’s total volume was traded — the zone where real market consensus happened. The upper boundary is the Value Area High (VAH) and the lower is the Value Area Low (VAL).
Why it matters: when price breaks above VAH it is moving into territory where very little volume traded before — directional moves tend to be faster here. When price opens above yesterday’s VAH there is a bullish bias. Below yesterday’s VAL, bearish. These levels act as powerful dynamic reference points throughout the session.
→ Imbalances
A price level inside the candle where one side so completely dominated the other that it signals aggressive, one-sided conviction. By default, when buy volume at a level is three times or more the sell volume at the adjacent level — or vice versa — it is flagged as an imbalance directly on the footprint. You can adjust this threshold in settings to match your own trading sensitivity.
Why it matters: stacked buy imbalances at the low of a candle show aggressive buyers defending that level — strong support. Stacked sell imbalances at the high show aggressive sellers defending resistance. These are the levels where the market ran out of opposition — and where price tends to react strongly on a revisit.
→ VWAP
The Volume Weighted Average Price — the running average price of the session weighted by actual volume traded. Not a simple price average. The true average cost of every contract that changed hands through the session.
Why it matters: price above VWAP means buyers are in control on average. Price below means sellers are. Knowing which side of VWAP you’re on gives you immediate context for every trade — and tells you whether you’re trading with or against the session’s flow.

→ Volume Profile
A session-wide view of volume at every price level — shown as horizontal bars alongside the chart. High Volume Nodes are prices where heavy trading happened — these act as magnets and strong support/resistance zones. Low Volume Nodes are prices with thin activity — price tends to move quickly through these, making them important for understanding where moves accelerate and where they slow down.
Why it matters: before entering a trade, knowing whether price is approaching a High Volume Node or a Low Volume Node changes how you size, enter, and manage the position entirely.
A Little Story of How & Why We Built This
When we decided to build Order Flow for DEXT T3, the first decision we had to make was also the most important one - what data do we build it on?
Some Order Flow tools are built on bid and ask data. They look at what buyers were willing to pay and what sellers were willing to accept, and use that to classify pressure at each price level. On the surface, that sounds reasonable.
But bid and ask data is intent. It is not reality. It is not a trade or a transaction - just an intent. Orders get placed and cancelled in milliseconds. What you see in the bid/ask is what participants wanted to show — not necessarily what they actually did.
We made a different choice. Order Flow on DEXT T3 is built on actual executed orders - real trades that happened at real prices on the exchange. Every number you see in the widget is sourced from trade-level data. Real fills. Real transactions. What actually happened at each price level inside each candle - not what was shown.
We built a custom data pipeline from scratch - one that captures and processes trade-level execution data fast enough to power a live Order Flow widget inside your terminal with no lag, no delay, and no compromise on the execution speed DEXT T3 is built on.
The Order Flow widget lives inside the same terminal where you trade - powered by the same DEXT engine that executes your orders. You read the candle. You see inside the candle. You act on it - all without leaving your workspace.
Built for Indian markets. Built for Indian traders. Built inside a terminal where analysis and execution are one.
It took longer to build this way. But we felt you deserved market reality — not market appearance.
How To Get Started with Order Flow
- Open DEXT T3 — Download for Mac | Download for Windows | or use dext.dhan.co
- Add the Order Flow widget to your DEXT T3 workspace
- Place it alongside your chart — price action and Order Flow always in view together
- Select your instrument and timeframe
- Read the buy vs. sell split and delta on every candle — and never look at price the same way again
See the candle. See inside the candle. Trade what’s actually happening.
Drop your questions, feedback, and how you plan to use Order Flow in the comments below — we’re always listening and always building with you. 
Happy Trading!
Bhavya