In addition to the Open Interest, Change in OI, Put Call Ratio, it would be great if you could add below information/features too in the Option Summary category on web.dhan.co.
Live Implied Volatility Percentile
Line chart or tabular chart showing daily end of the day Implied Volatility Percentile for the index or stock
Line chart or tabular chart showing daily end of the day PCR for the series
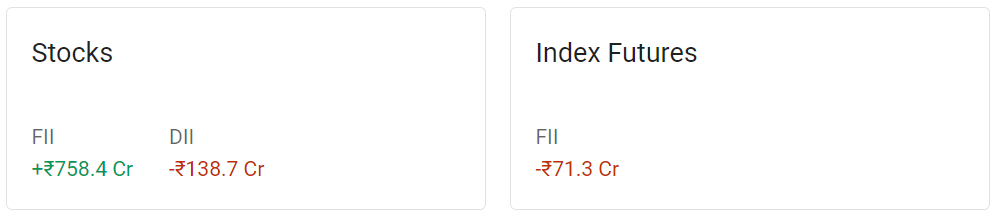
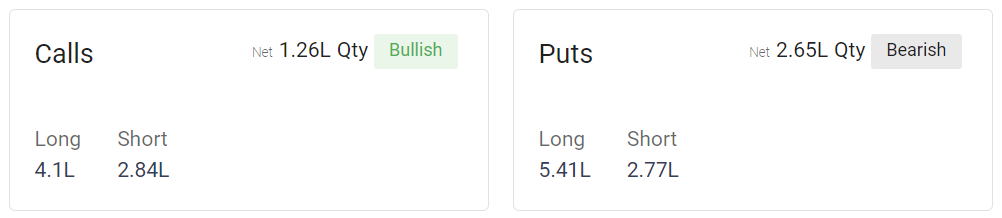
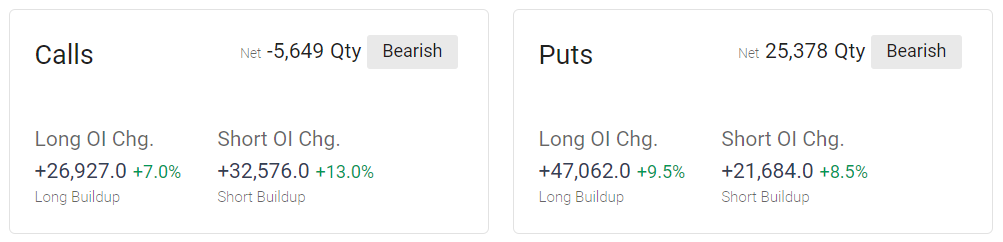
FII activity in stocks and derivatives as shown below;
I request you to look into these features, if possible. These are some key information for options traders like me who predict market direction using PCR, OI, FII data and decide strategies based on Implied Volatility Percentiles (IVP).
Great points here, have noted few of them here. FII / DII information we have thought of for very long time and have some initial thoughts around this.
At this moment, the biggest request we are working on for Option Traders on Dhan is our web version of Options Trader + Custom Strategy Builder. We are ensure we deliver this in next few weeks (before October), and for some time enhance the experience as always we do on Dhan and pick up the next.
FII / DII activity, etc is bit easier to pull off I think (we will evaluate in detail when we pick this), but for now heads-down focus on getting you the best strategy builder + options trader experience on Dhan web.
Hey @ravi_krishna, you had asked for a line chart of daily implied volatility and a live IV percentile read, which was a sharp ask at the time. The IV line chart part is live now. The ATM IV Chart on Options Trader Web plots ATM implied volatility against spot continuously, with up to 45 days of history across 1m to 60m timeframes, though a dedicated IV percentile read is a separate piece we have noted. It is under Insights, then IV Chart, on options-trader.dhan.co. Would an IV percentile band layered on this chart be the natural next step for you?