Hello Traders,
Every trader has their own ways and methods for monitoring the market. Some individuals opt for straightforward tracking of the Primary Index’s price and chart, or perhaps a watchlist of Index constituents. Others may prefer a different approach, monitoring all Sectoral Indices or utilising Heat Maps.
At Dhan, we have continued to offer several Market Tracking features, such as Market Watch in Dhan Web, Live Market Scanner, Index Tracker in the TV console, Pinned Index across Apps, Movers & Gainers, and more. Each of these features serves a distinct purpose.
On top of these features, we wanted to create a comprehensive market tracking tool that helps traders and investors in gaining a precise understanding of market conditions. For the same purpose, we have introduced a new market tracking tool - Live Market Action.
Live Market Action with Resistance & Support in Dhan Web
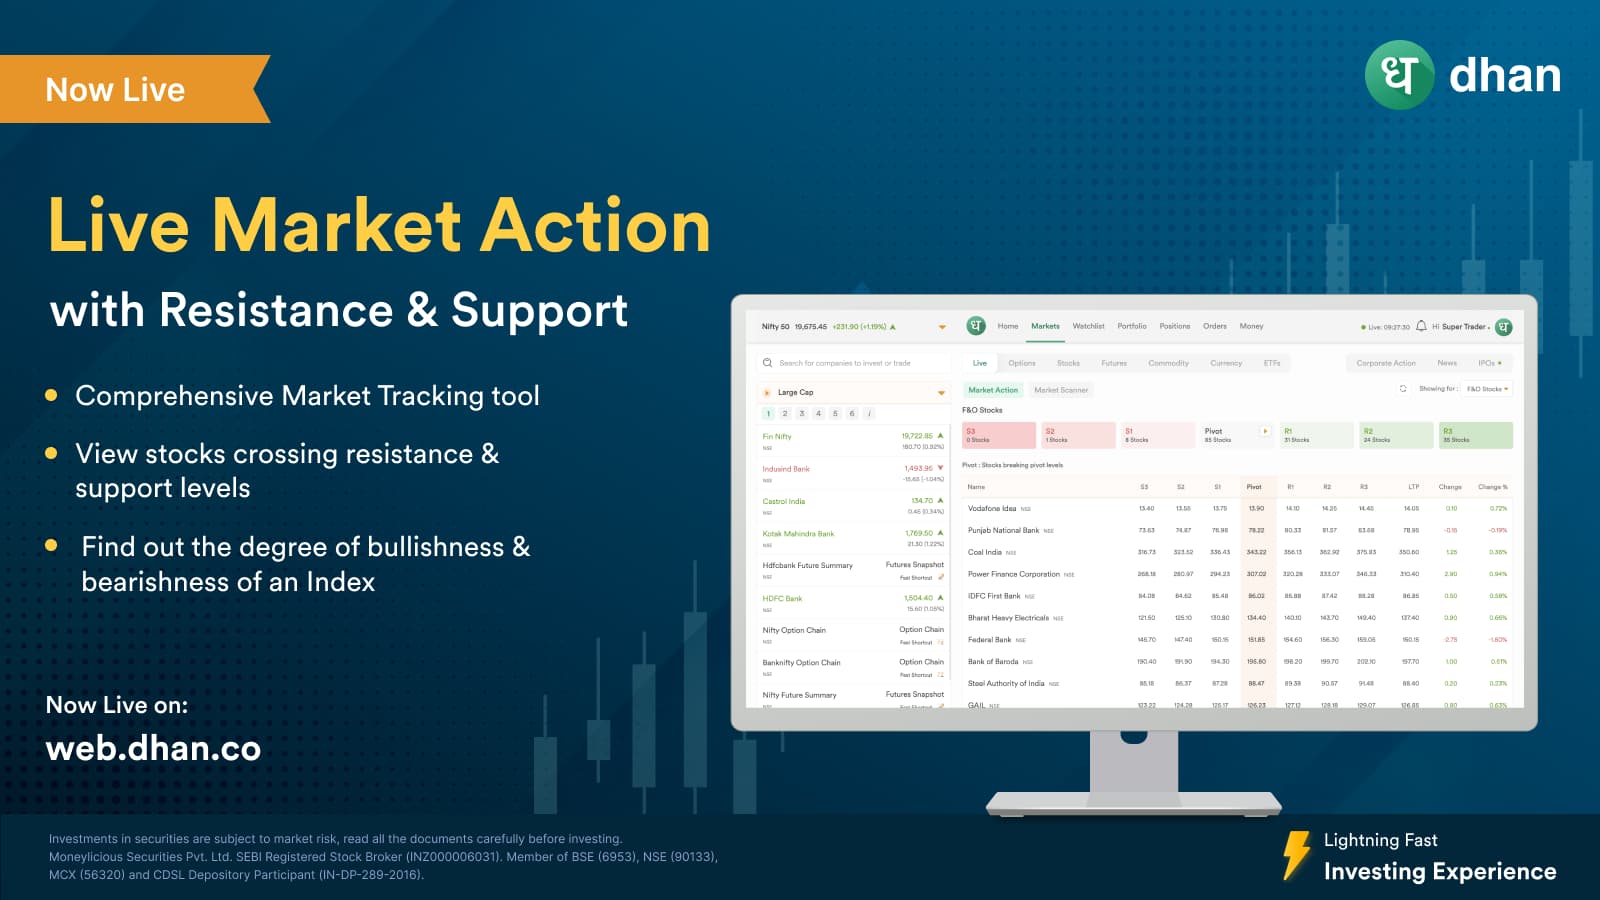
Live Market Action goes beyond the usual Price Movement, it shows how many stocks within the Selected Index have crossed their Resistance and Support levels. This not only informs you of the Market’s Bullish or Bearish status but also provides insights into the degree of Bullishness or Bearishness in general.
To access this feature, navigate to the ‘Markets’ section in Dhan Web (web.dhan.co), then click on “Live” and select “Market Action”. By default, the results are for F&O stocks, but you can choose your desired index from the dropdown menu on the right. You have the option to view the Market Action for - F&O Stocks, Nifty 50, Nifty 100, Nifty 200 and the Nifty 500.
The Red-Green line illustrates the Advances & Declines status of the index, indicating how many stocks have moved positively and negatively compared to the previous day. The Tabs displays the number of stocks that have breached specific resistance and support levels. Clicking on this tab provides a table with a comprehensive list of these stocks along with their price details.
The Resistance, Support & Pivot points are calculated based on standard Pivot Points formula which is :
- Pivot = (High + Low + Close) / 3.
- R1 = 2×Pivot − Low
- S1 = 2×Pivot − High
- R2 = Pivot + (High − Low)
- S2 = Pivot − (High − Low)
- R3 = High + 2×(Pivot − Low)
- S3 = Low − 2×(High − Pivot)
Live Market Action is now available for all users on Dhan Web. We believe this is going to be useful for the Traders & Investors to get a quick overview of the market and make their trading & investing decisions better.
Let us know about your experience in the comments below.
Happy Trading,
Naman