Hi Traders,
Timely and accurate information is crucial when markets move fast, especially when you are trading in leveraged trading instruments like Options.
In our early journey, we launched Options Trader by Dhan on Web & App to ensure that Traders have access to all features, tools, data and insights about Options Trading in one place.
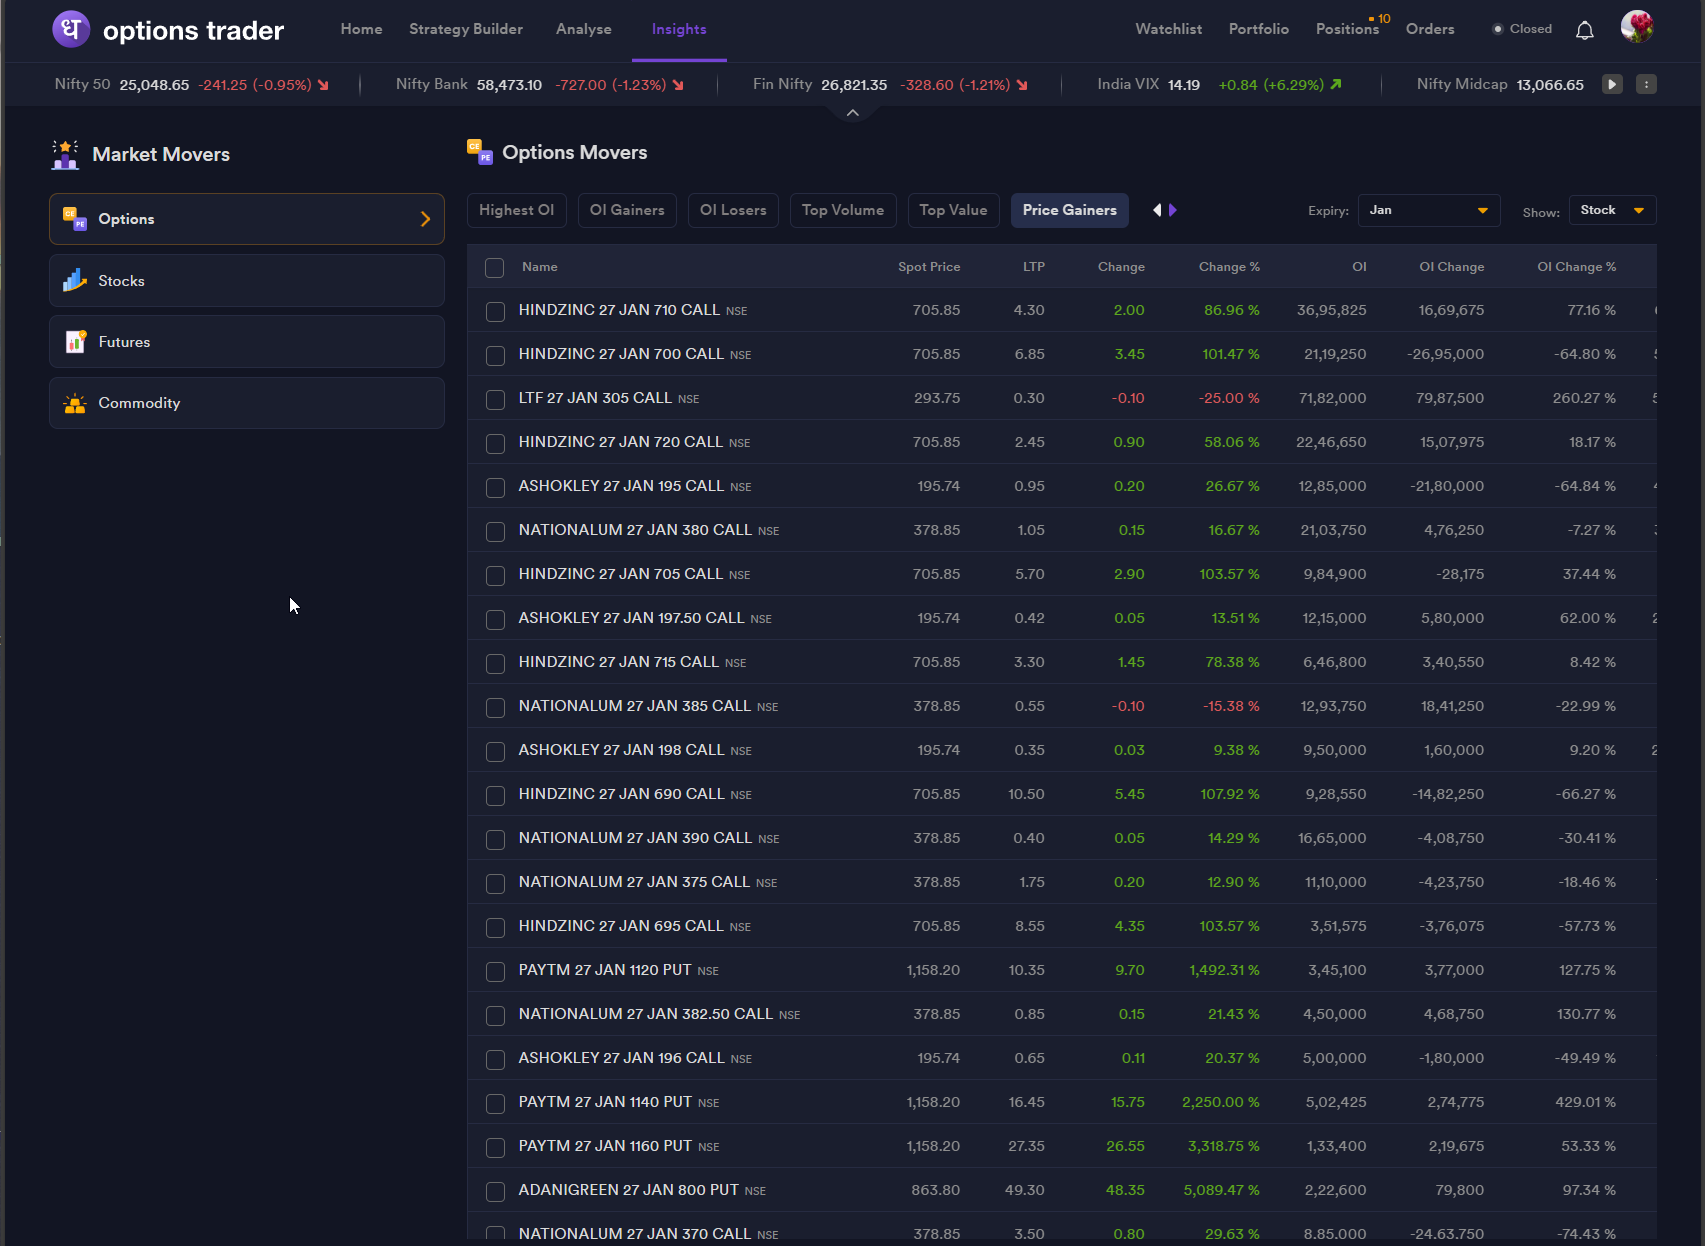
We have consistently worked towards giving traders the tools to understand price action, volatility, market shifts as they happen and that’s why we bring real-time market analysis features such as Advanced Option Chain, Live Market Scanner, Multistrike OI Graph, Market Movers, Straddle Chain and much more ensuring you receive the right information at the right moment.
One of the biggest challenges traders face is tracking the movement of volatility in real time. The combined premium of the ATM call and put is a critical measure of market movement and volatility. However, as the market moves and the underlying price crosses from one strike to the next, the ATM strike changes. Traders must jump between strikes, recalculate combined premiums and follow how volatility evolves. This becomes slow, manual and often leads to delayed decisions during critical moments.
We believe in making this process more simple, automatic and keep you aligned with the market’s pulse throughout the day, without any manual effort. That is why we are excited to introduce a feature that puts the true pulse of the market at your fingertips:
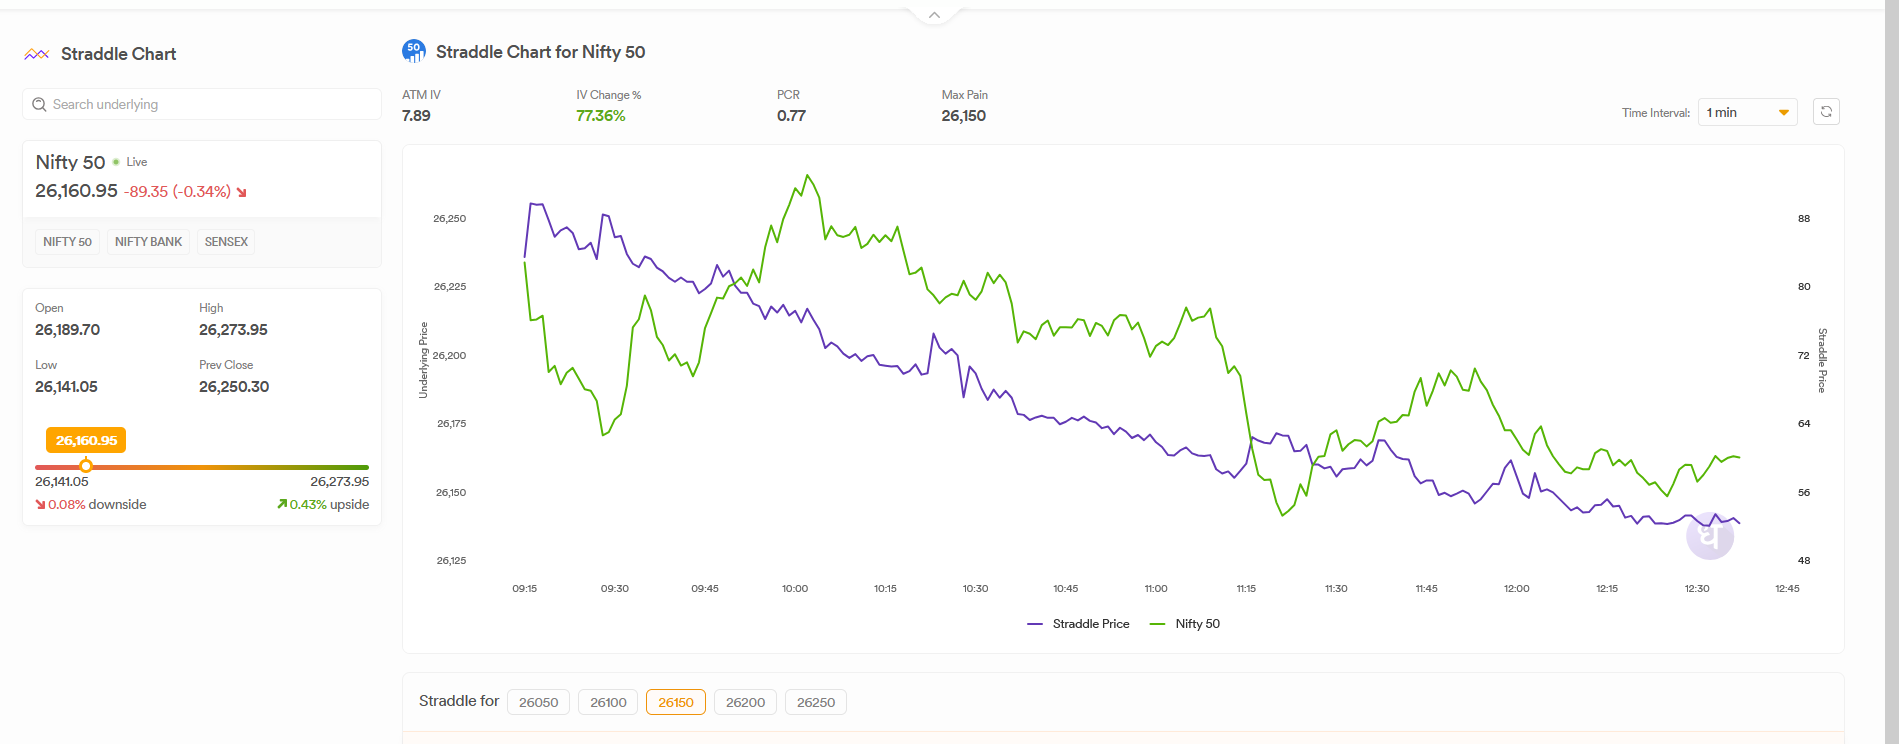
Introducing Real-Time Straddle Chart on Options Trader Web
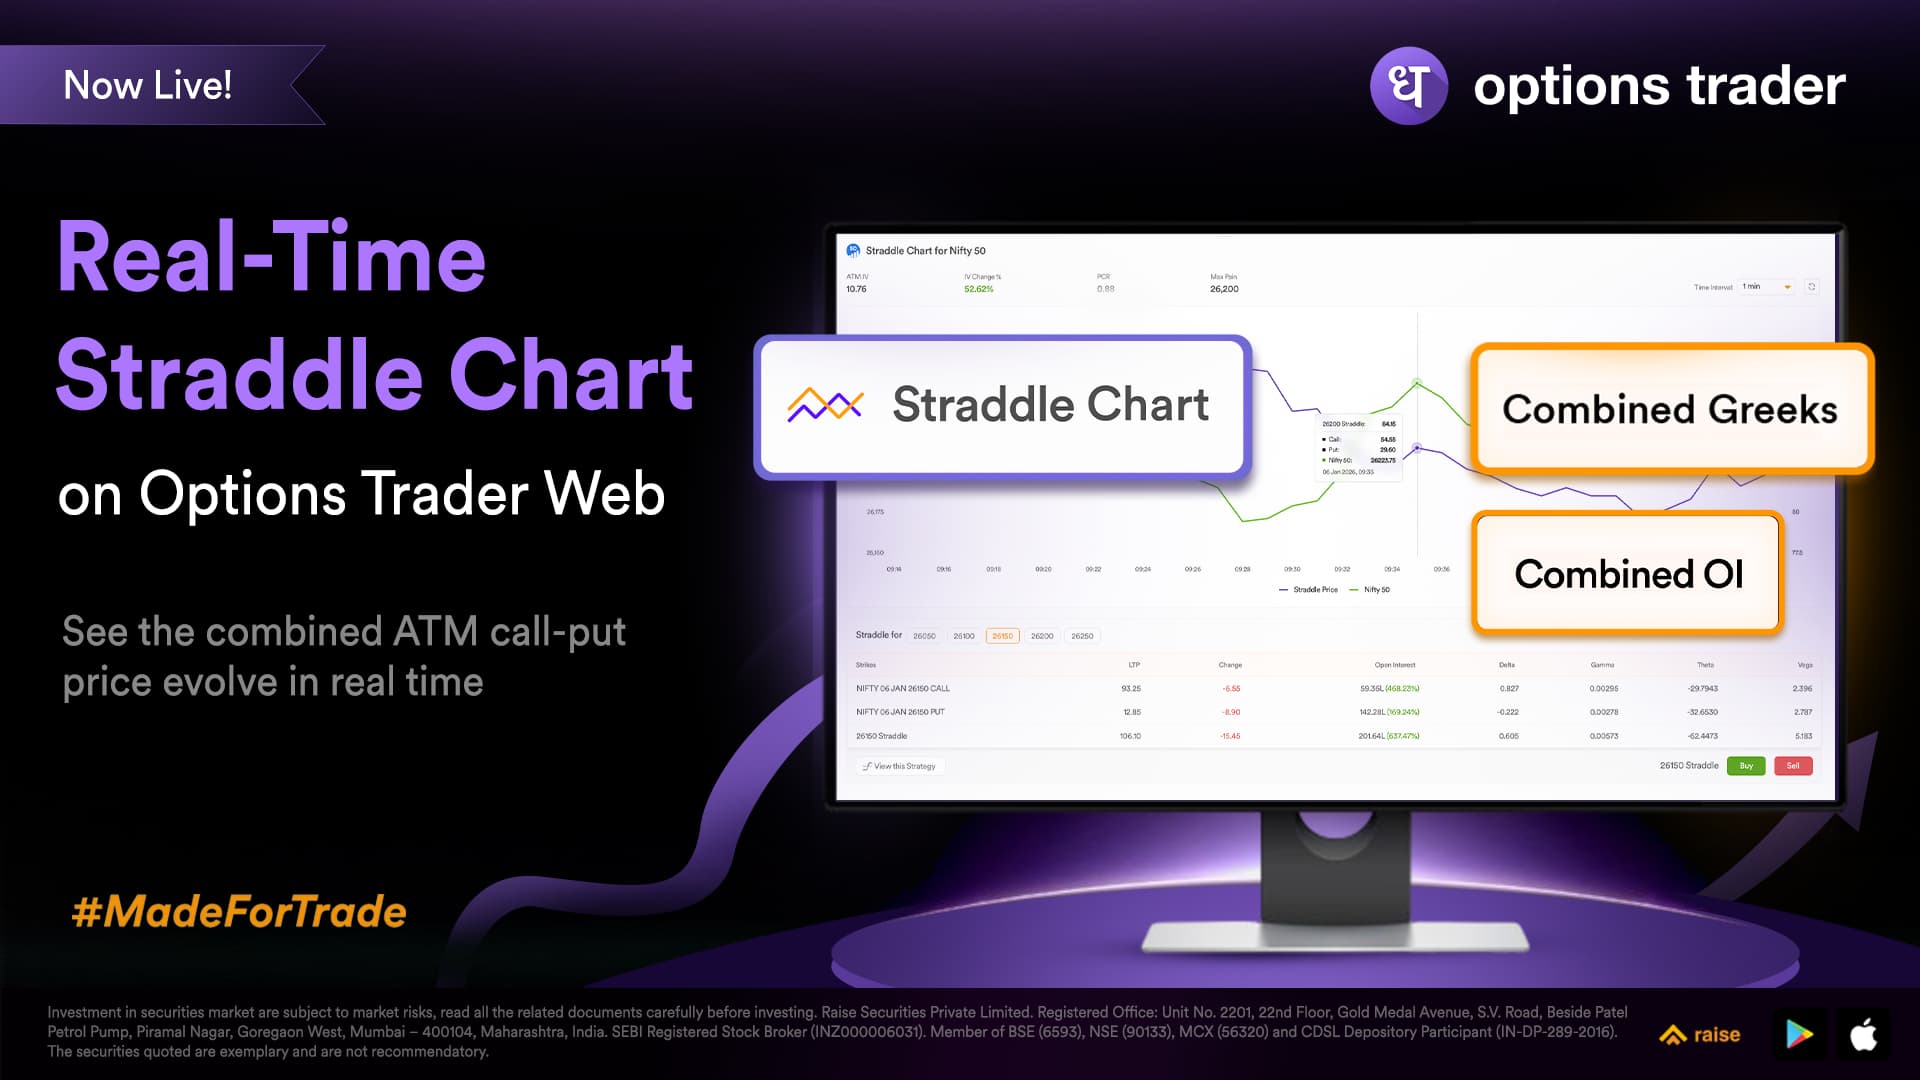
The Straddle Chart displays the combined price of the current ATM call and put option of the underlying instrument. As the underlying instrument’s price moves throughout the day and the ATM strike naturally shifts, the chart automatically updates to display the combined price of the new ATM call and put, giving you a continuous, real-time view of how the market is evolving at the most relevant strike price.
We have packed the straddle chart with robust functionalities designed for in-depth analysis:
-
Instrument Selection: Easily toggle between all NSE/BSE indices, F&O Stocks, and commodities across different expiries.
-
Multiple Timeframes: You can analyse straddle dynamics across 1-minute, 3-minute, 5-minute, 15-minute or 30-minute intervals for precise analysis.
-
Underlying Instrument Overlay: For direct comparison, an overlay of the underlying spot price is directly onto your straddle chart, allowing you to visually correlate volatility shifts with price action.
-
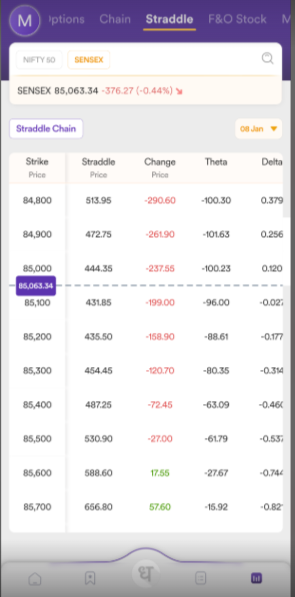
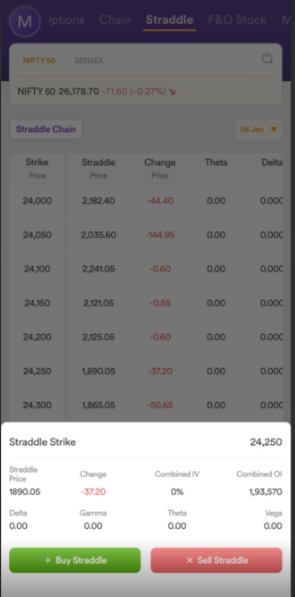
Key Straddle Information: The table features key information of the straddle and the ATM strikes such as LTP, LTP Change, OI, OI Change and Greeks.
With this, you can see exactly how volatility behaves as the market moves, follow time decay through the day, and make faster, data-backed decisions. You no longer have to switch between strikes or manually calculate combined premium moves.
Log in to Options Trader Web and experience the all-new Straddle Chart today.
We look forward to hearing your feedback as we continue to build with you.
Happy Trading,
Jai Supreeth