Hello Traders,
Charts on Dhan (powered by TradingView) are definitely one of the most loved features on Dhan and they also stand out amongst all the charting products out-there.
Not just the features and capabilities that we keep introducing to TV Charts, our users like many of the lesser known features like unlimited indicators, multi-chart layouts or your drawings saved on cloud automatically. And all this while, we have kept on improving your charting platform with analytical add-ons like Scalper, Alerts, Market Replay, OI Profile, Full Market depth and much more.
As you also know, we have always been deeply working with the TradingView team and have been building a lot of core charting experience with them from our early days. And in doing so, we end up building new features, optimising platforms and upgrading infra every week to ensure we can live up to your expectations.
To give you a sense of what goes behind building a Dhan charting experience, we did 56 releases / updates in 2024 alone which aimed at achieving superior user experience, especially on charts. That’s the kind of effort we put behind everything you see at Dhan.
We continue on our endeavour to further enhance charting and keep you on top of markets always. And in this pursuit, we have updated your TradingView Charting experience with the latest library update on tv.dhan.co which has been upgraded to v28.4. This comes with exciting new updates to your charting interface.
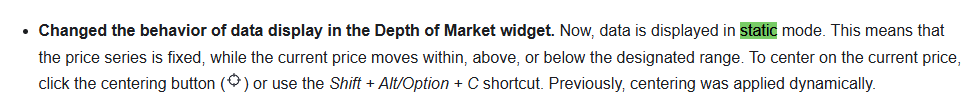
Trading View Order Window and Depth of Market (DOM) have now been combined to a single tab and it can be accessed from the bottom drawer. We know this will require some ‘getting-used’ to, we have already shared our feedback on this with the TradingView team.
We have fixed one of the most painful parts of trading from charts - watchlist sorting. This has been a long standing request and now you can sort watchlist with ease using TradingView sorting.
A new Quick Search for all you to search across drawings, UI settings, and functions. You can click on the button on the top navigation bar or just press Ctrl/Cmd + K.
Along with this, we are also introducing Volume Candles - one of the most popular candlestick types on TradingView in recent times.
Some brand new indicators and enhancements from TradingView team:
-
52 Week High/Low
To plot 52 Week High/Low on basis of Open/Close or high/low right on top of charts -
Rank Correlation Index
Uses price and time change data to identify potential shifts in market sentiment -
Added VWAP bands in Anchor VWAP drawings
-
Added new multi-layout combinations
-
SuperTrend Indicator Starting Point now is from the input tab
and more updates.
And this is one part of it. We have some further updates for you, which our team has built it out. Adding some of the most requested indicators from the community:
-
Zero-Lag Exponential Moving Average (Zero Lag EMA v2)
This eliminates the inherent lag associated with all trend following indicators which average a price over time.
-
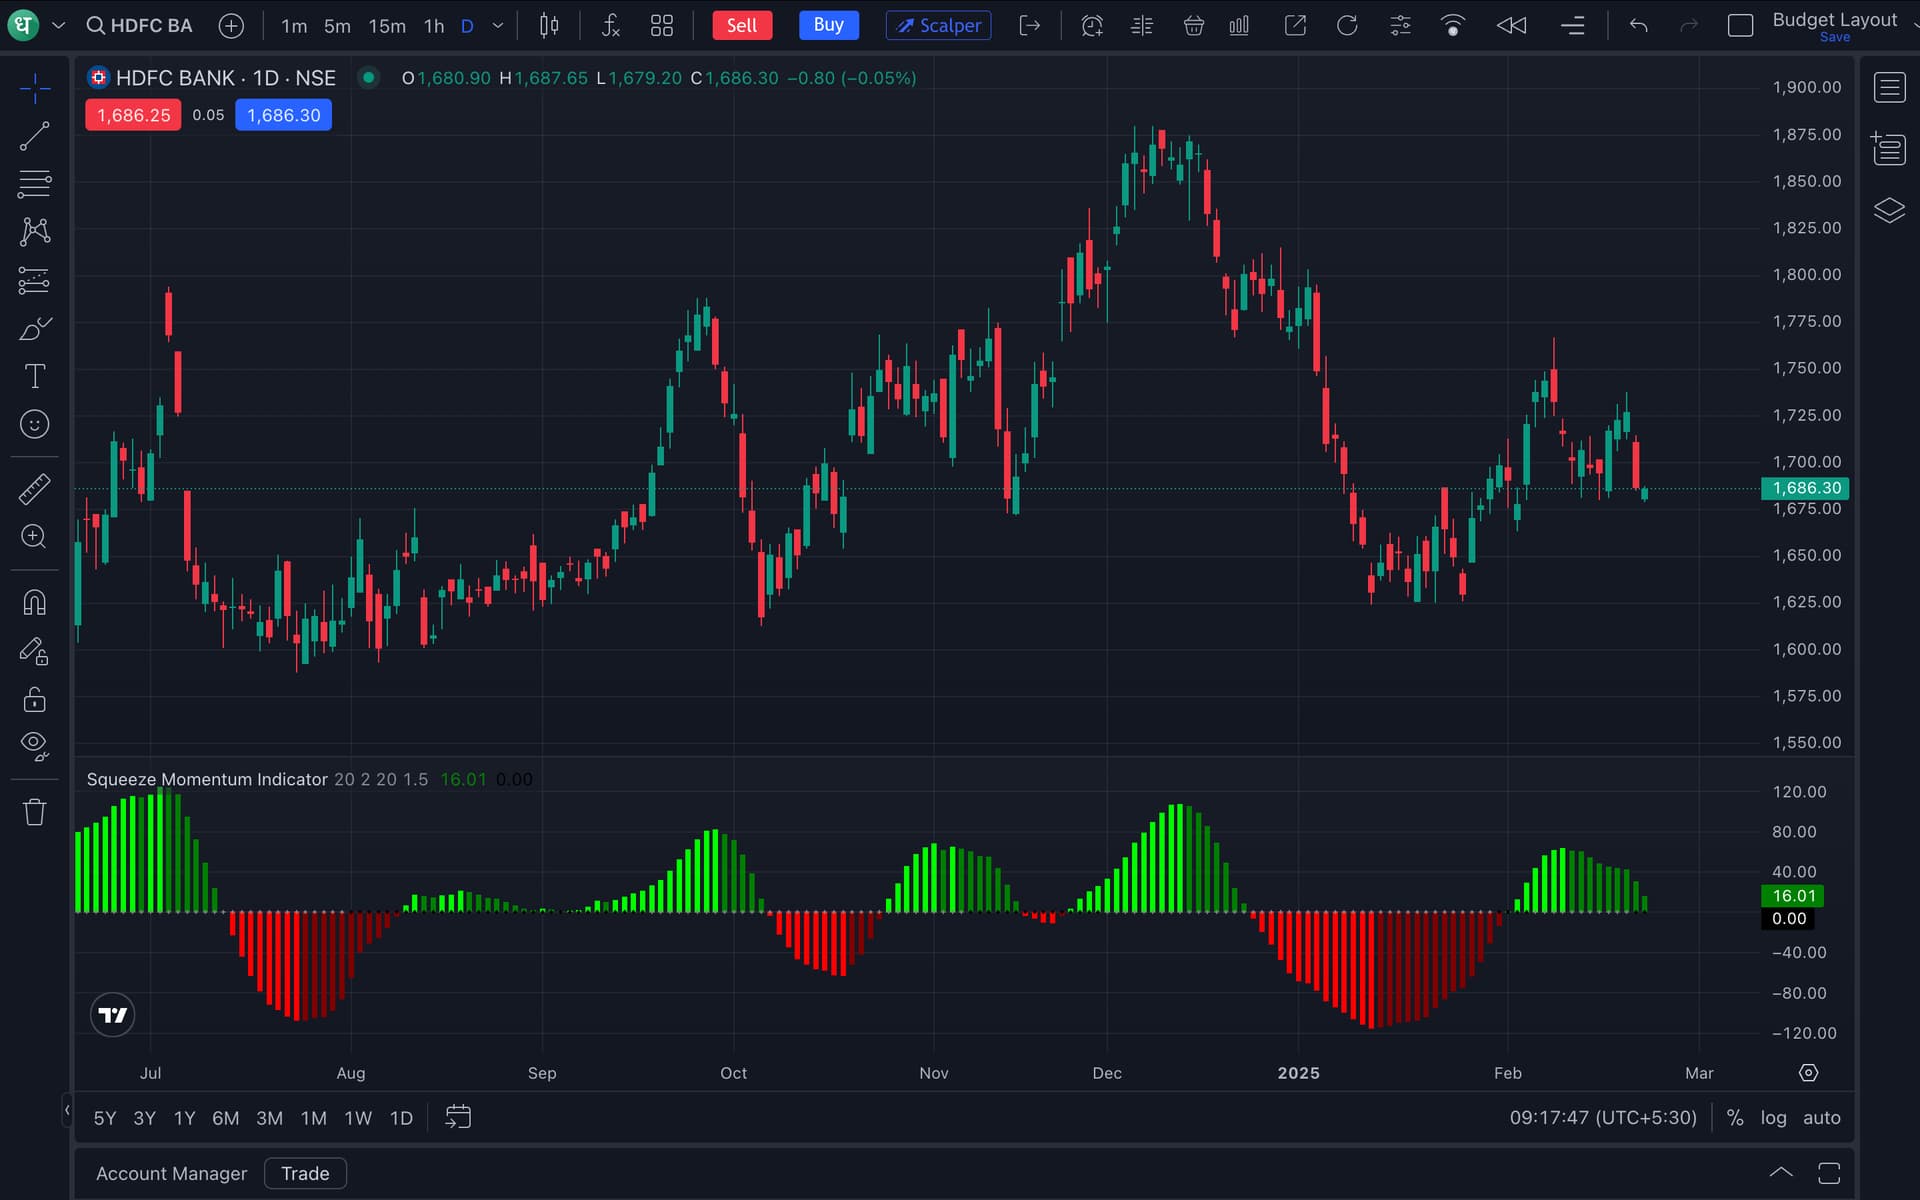
Squeeze Momentum Indicator
This combines volatility and momentum to identify trading opportunities. It is built on top of Bollinger Bands and Keltner Channels.
-
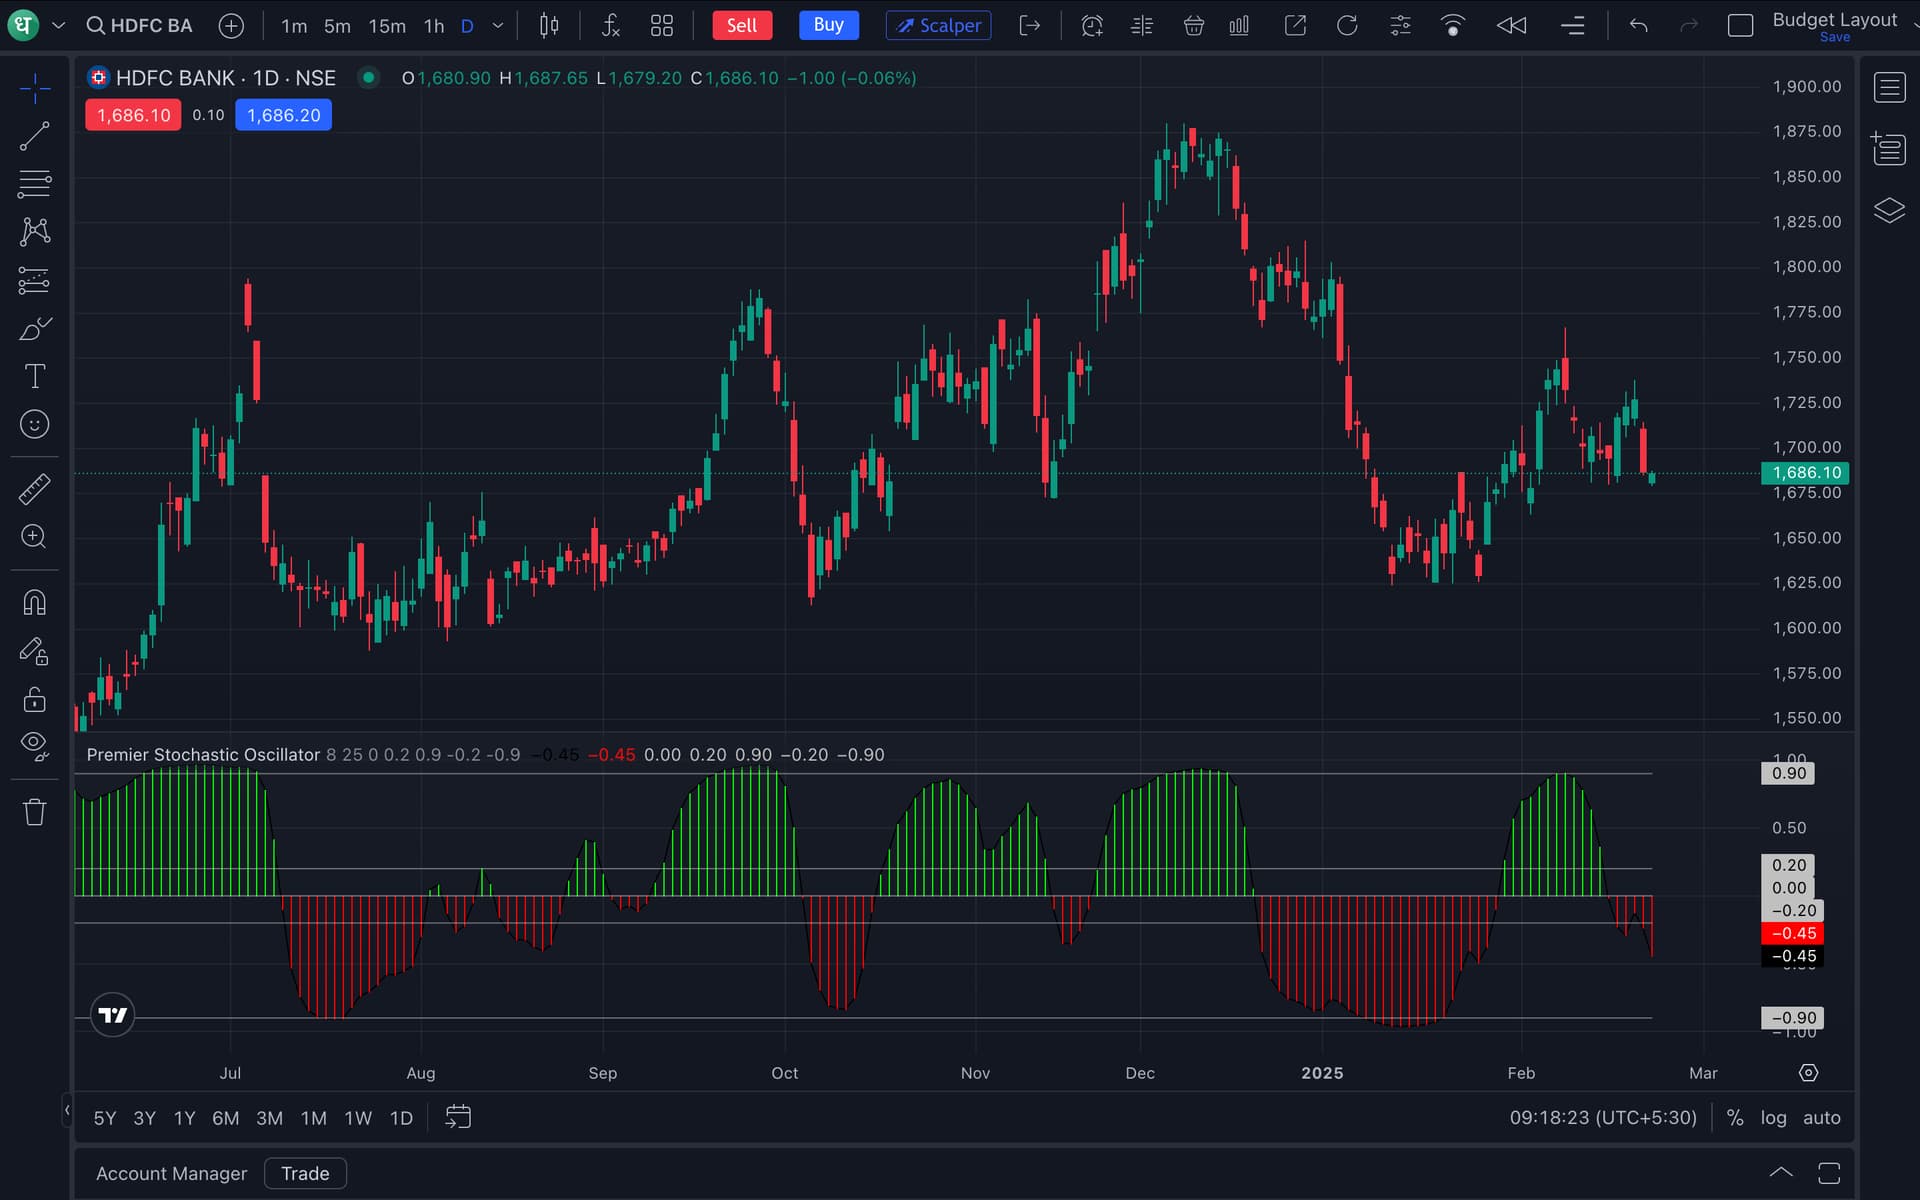
Premier Stochastic Oscillator
This indicator provides a quick response to changes in market direction. This highly sensitive indicator allows for early anticipation of price turns.
-
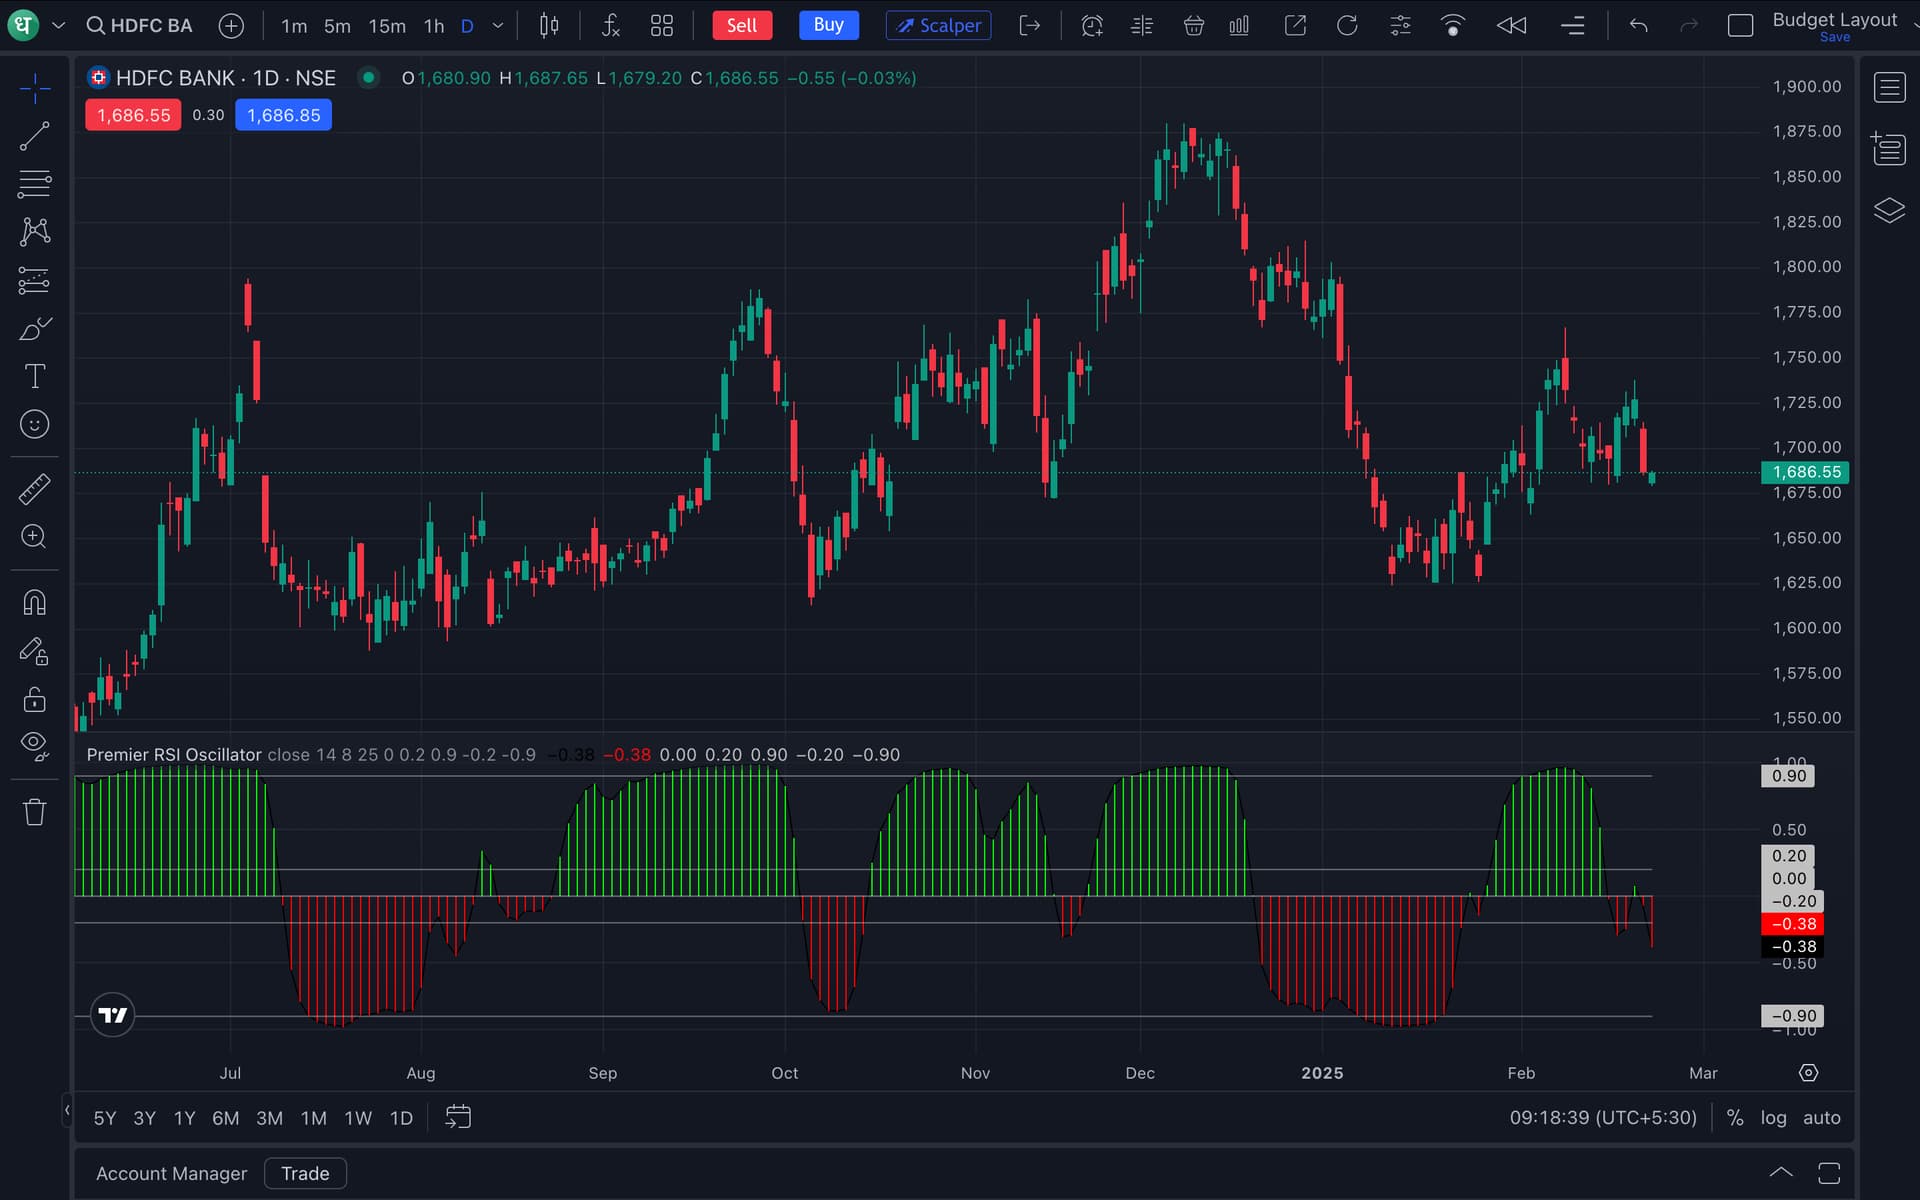
Premier RSI Oscillator
This resembles the premier stochastic oscillator and helps identify overbought and oversold conditions, divergences, and potential trend reversals.

To enhance your core charting experience, we have also revamped how notifications appear on top of charts. It is now much simpler and concise. We rolled this out selectively before the library update and from today, it is available to all charting users.
We keep on building your charting experience to be the best in industry, on top of your feedback and suggestions. We have a range of new updates lined up that we are really excited to introduce.
We would love to hear your feedback on this update, and also suggestions to improve.
Happy Trading!
Hardik