Dear Investors,
All of us at Dhan are excited to continue bringing you deeper market insights across our platforms — be it on Dhan, ScanX, or right here on MadeForTrade.
Over time, we have been building tools that help investors and traders make more informed decisions — from Portfolio Insights to Journal, Trader’s Diary, Pre-Market Insights, and ScanX. Each of these has helped users stay closer to markets with actionable data and research.
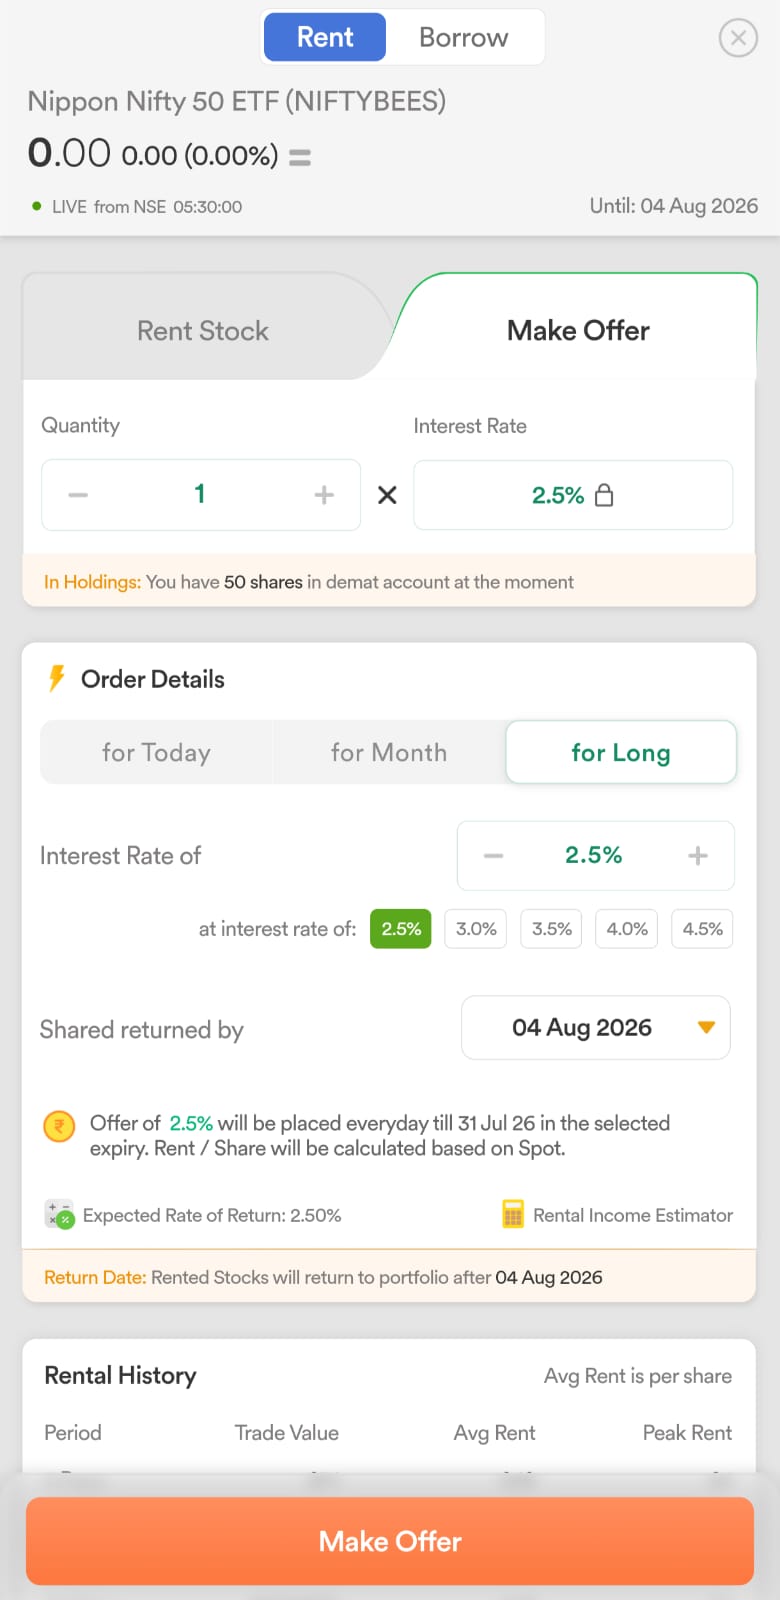
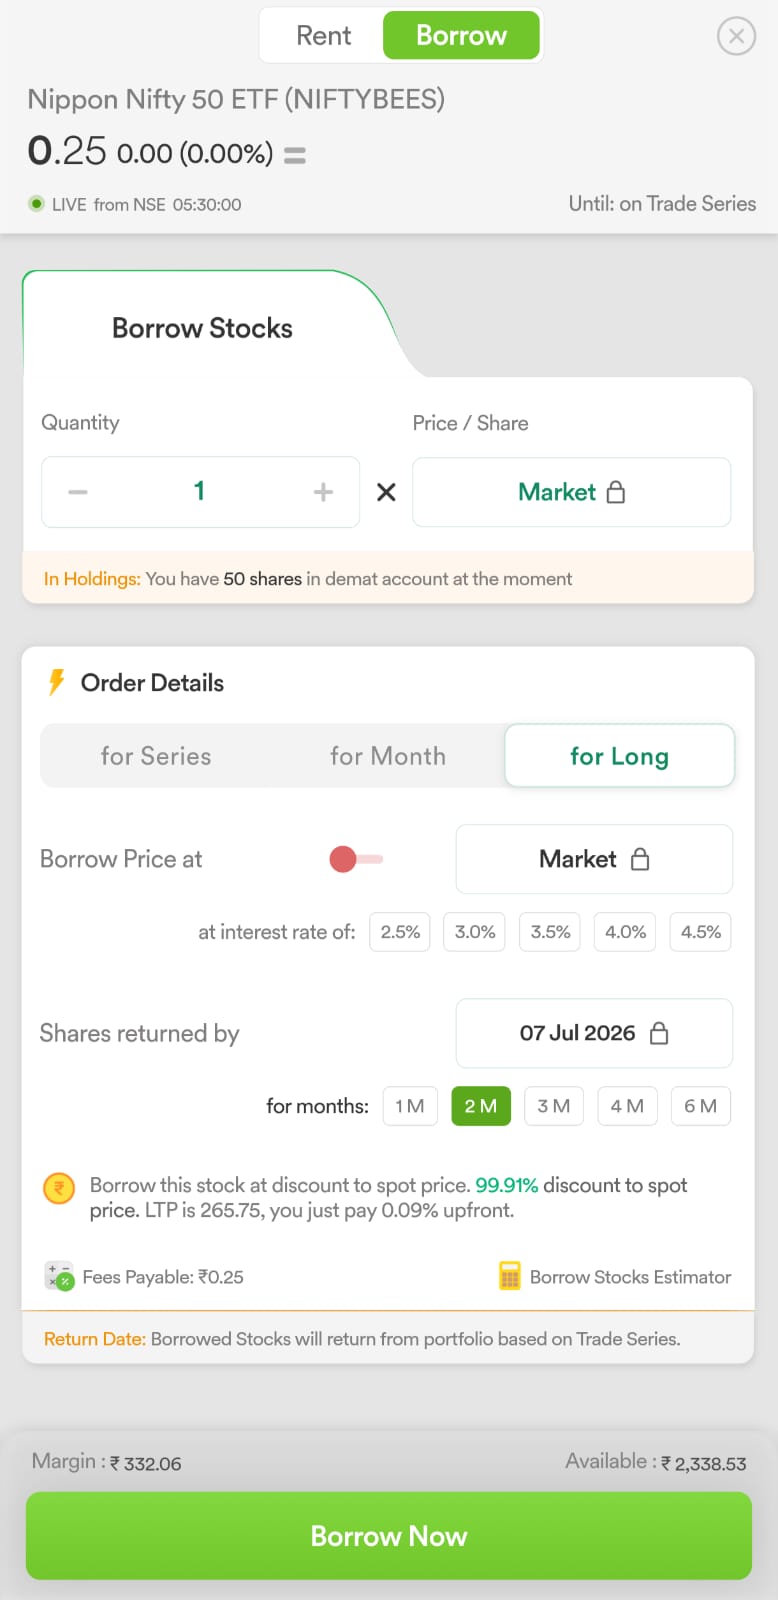
One of the most unique offerings we introduced is Securities Lending and Borrowing Mechanism (SLBM) — enabling long-term investors to earn passive income by lending idle holdings, while also supporting short-side participation in the market.
Building on this, we continue to share monthly SLBM insights to help you understand lending trends, demand patterns, and yield opportunities across stocks.
April 2026 - SLBM Key Numbers & Insights at a Glance
| Metric | Value |
|---|---|
| Total Rented Value | ₹1,35,14,17,712.56 (₹135 Crores) |
| Total Rented Volume | 24,00,20,192 shares |
| Active Stocks in SLBM | 294 scrips |
April saw a meaningful jump in SLBM activity, with rented value nearing ₹135 Cr and volumes crossing 24 crore shares — indicating stronger participation from both lenders and borrowers.
While large and liquid names continued to dominate lending volumes, there was also a noticeable expansion in mid-cap participation. At the same time, several stocks delivered elevated yields, suggesting pockets of tight supply and sustained short-side demand.
For lenders, this reinforces SLBM as a powerful way to generate additional returns on long-term holdings — without altering underlying portfolio positions.
Top 25 Stocks Traded in SLBM — April 2026
| Name | Expiry | Peak Rent / Share | Peak Yield | Avg. Rent / Share | Avg. Yield | Traded Volume | Traded Value |
|---|---|---|---|---|---|---|---|
| RVNL | 7 Jul 26 | 19.6 | 60.45% | 11.19 | 32.07% | 82,08,997 | 9,18,82,014.07 |
| CDSL | 7 Jul 26 | 15.5 | 7.40% | 7.89 | 4.78% | 8,98,309 | 70,91,782.61 |
| CAMS | 7 Jul 26 | 17 | 17.97% | 5.59 | 7.59% | 8,77,840 | 49,04,356.26 |
| ASTRAL | 2 Jun 26 | 111 | 93.49% | 48.65 | 25.86% | 8,62,181 | 4,19,41,510.65 |
| ETERNAL | 5 May 26 | 1.25 | 20.60% | 0.78 | 9.40% | 8,27,837 | 6,42,204.82 |
| ASHOKLEY | 2 Jun 26 | 3.66 | 13.21% | 0.08 | 0.63% | 8,07,300 | 61,847.19 |
| PPLPHARMA | 5 May 26 | 1.99 | 27.84% | 0.9 | 16.33% | 7,86,281 | 7,11,009.77 |
| NATIONALUM | 2 Jun 26 | 1.25 | 3.46% | 0.83 | 2.28% | 7,78,478 | 6,45,152.27 |
| BHARATFORG | 2 Jun 26 | 7.99 | 5.50% | 4.06 | 1.99% | 7,26,896 | 29,48,049.00 |
| JUBLFOOD | 2 Jun 26 | 15 | 54.05% | 8.44 | 15.77% | 7,24,563 | 61,15,023.93 |
| BLUESTARCO | 2 Jun 26 | 40 | 21.90% | 14.17 | 7.37% | 7,18,885 | 1,01,85,397.51 |
| TRENT | 5 May 26 | 14.9 | 7.76% | 6.2 | 2.18% | 7,02,153 | 43,53,563.62 |
| RELIANCE | 2 Jun 26 | 0.75 | 0.75% | 0.5 | 0.33% | 6,73,593 | 3,36,032.11 |
| LICI | 2 Jun 26 | 9.95 | 12.69% | 4.62 | 6.28% | 6,35,795 | 29,38,453.10 |
| COALINDIA | 2 Jun 26 | 2.2 | 4.52% | 0.91 | 2.30% | 56,65,126 | 51,75,485.62 |
| TECHM | 2 Jun 26 | 5 | 6.64% | 3.39 | 2.53% | 5,98,010 | 20,26,204.25 |
| WIPRO | 6 Apr 27 | 9.5 | 49.15% | 3.1 | 16.95% | 5,90,96,631 | 18,29,71,002.15 |
| PERSISTENT | 5 May 26 | 149 | 18.03% | 70.98 | 11.42% | 5,26,558 | 3,73,73,210.77 |
| L&T | 2 Jun 26 | 300 | 49.26% | 83.3 | 15.64% | 5,14,134 | 4,28,29,436.34 |
| TATAELXSI | 2 Jun 26 | 59.99 | 19.95% | 31.67 | 7.95% | 5,10,759 | 1,61,73,808.58 |
| IRFC | 2 Jun 26 | 1.02 | 9.94% | 0.74 | 5.97% | 40,92,590 | 30,35,561.69 |
| SBICARD | 2 Jun 26 | 21.99 | 66.73% | 13.66 | 15.90% | 4,56,311 | 62,34,542.33 |
| NTPC | 2 Jun 26 | 1 | 7.79% | 0.42 | 4.16% | 4,55,639 | 1,89,623.48 |
| NAM-INDIA | 2 Jun 26 | 25 | 29.45% | 8.94 | 8.23% | 4,25,966 | 38,08,426.55 |
| WEBELSOLAR | 5 May 26 | 2 | 64.01% | 0.66 | 21.77% | 4,25,049 | 2,81,954.98 |
Top 25 Yield Stocks in SLBM — April 2026
Stocks where lenders earned the highest annualised yields on their idle holdings this month:
| Name | Expiry | Peak Rent / Share | Peak Yield | Avg. Rent / Share | Avg. Yield | Traded Volume | Traded Value |
|---|---|---|---|---|---|---|---|
| CPPLUS | 5 May 26 | 105.19 | 94.20% | 105.19 | 94.20% | 3 | 315.57 |
| STARHEALTH | 5 May 26 | 10 | 40.29% | 8.89 | 35.83% | 2,000 | 17,787.65 |
| RAIN | 5 May 26 | 2 | 36.55% | 1.87 | 34.20% | 16,000 | 29,940.00 |
| RVNL | 7 Jul 26 | 19.6 | 60.45% | 11.19 | 32.07% | 82,08,997 | 9,18,82,014.07 |
| TANLA | 2 Jun 26 | 7 | 54.79% | 4.12 | 31.94% | 56,019 | 2,30,809.85 |
| GALLANTT | 2 Jun 26 | 15 | 34.65% | 13.72 | 31.70% | 8,101 | 1,11,168.00 |
| CYIENTDLM | 5 May 26 | 5 | 37.41% | 4.02 | 30.08% | 223 | 896.60 |
| ASTRAL | 2 Jun 26 | 111 | 93.49% | 48.65 | 25.86% | 8,62,181 | 4,19,41,510.65 |
| EASEMYTRIP | 5 May 26 | 0.13 | 24.68% | 0.13 | 24.68% | 2 | 0.26 |
| COHANCE | 5 May 26 | 3.5 | 37.00% | 2.15 | 22.71% | 2,78,712 | 5,99,509.73 |
| KFINTECH | 7 Jul 26 | 39.75 | 30.87% | 18.77 | 22.16% | 17,90,724 | 3,36,03,420.31 |
| WEBELSOLAR | 5 May 26 | 2 | 64.01% | 0.66 | 21.77% | 4,25,049 | 2,81,954.98 |
| OBEROIRLTY | 2 Jun 26 | 62.01 | 38.21% | 23.62 | 17.53% | 1,81,569 | 42,89,023.97 |
| SOLARA | 2 Jun 26 | 8 | 17.45% | 8 | 17.45% | 700 | 5,600.00 |
| SAGILITY | 5 May 26 | 0.64 | 20.20% | 0.54 | 16.97% | 2,438 | 1,310.91 |
| WIPRO | 6 Apr 27 | 9.5 | 49.15% | 3.1 | 16.95% | 5,90,96,631 | 18,29,71,002.15 |
| HIRECT | 5 May 26 | 12 | 20.85% | 9.46 | 16.64% | 50,934 | 4,81,813.44 |
| PPLPHARMA | 5 May 26 | 1.99 | 27.84% | 0.9 | 16.33% | 7,86,281 | 7,11,009.77 |
| HAVELLS | 6 Apr 27 | 15 | 23.97% | 7.89 | 16.33% | 2,34,847 | 18,52,627.36 |
| SBICARD | 2 Jun 26 | 21.99 | 66.73% | 13.66 | 15.90% | 4,56,311 | 62,34,542.33 |
| JUBLFOOD | 2 Jun 26 | 15 | 54.05% | 8.44 | 15.77% | 7,24,563 | 61,15,023.93 |
| L&T | 2 Jun 26 | 300 | 49.26% | 83.3 | 15.64% | 5,14,134 | 4,28,29,436.34 |
| NCC | 5 May 26 | 1.2 | 15.09% | 1.19 | 15.02% | 45 | 53.76 |
| PVRINOX | 5 May 26 | 3 | 14.87% | 3 | 14.87% | 1,000 | 3,000.00 |
| NLCINDIA | 5 May 26 | 3 | 20.23% | 2.18 | 14.68% | 36 | 78.38 |
For real-time tracking, weekly changes, stock-level detail, and positions added or liquidated, head over to Dhan App or Web. SLBM Market Insights are available on ScanX Insights.
SLBM on Dhan has been quietly turning into one of the more useful ways for long-term holders to earn extra on shares they’re already sitting on. A lot of what’s shipped here over the past year has come from conversations on the forum, and we’ve kept building on that. Sharing a few related launches if you’re exploring stock lending:
- Earn More by Renting Stocks via SLBM — the main launch post for SLBM on Dhan. Worth a read if you’re new to the idea of stock lending. Walks through how you can rent out long-term holdings to borrowers and earn a daily fee, without giving up ownership or losing your corporate-action benefits.
- Zero Brokerage on Renting & Borrowing via SLBM — no brokerage charges on either lending or borrowing stocks via SLBM on Dhan. Makes the math cleaner for smaller-ticket lenders — your effective yield is what you see on the screen, no fees eating into it.
- SLBM Lending Insights on ScanX — see live SLBM lending data inline on ScanX while you screen. Helpful for spotting which stocks are in demand for lending right now, so you can decide what to put up for rent based on real signal rather than guesswork.
- SLBM Market Insights – March 2026 — the previous month’s SLBM trend report covering rental rates, most-lent stocks, and yield opportunities. Useful as a baseline for comparing month-over-month moves in lending demand.
- SLBM Taxation Explained — a clear breakdown of how stock renting and borrowing get taxed in India. Worth reading once if you’re starting out, since the tax treatment is different from regular short-term and long-term capital gains.
- All New Option Chain with Smart Tags & New Insights on Dhan Web — the upgraded Option Chain on Dhan Web with richer positioning insights. Worth a look if you also trade derivatives alongside lending out your long-term portfolio.
- Mutual Fund Holdings & Insights on ScanX — mutual fund holdings data layered into ScanX. Useful for spotting which stocks active fund managers are holding, alongside SLBM lending demand for the same names.
- FII & DII Market Data on ScanX Insights — FII and DII flow data now visible on ScanX Insights. Another lens on institutional positioning, which often correlates with where SLBM lending demand shows up too.
Quick question for everyone here — which stocks have you found best for putting up on SLBM so far? Sharing your experience would be useful for traders just starting to lend out their holdings.
We’ll be back next month with the May 2026 update. Drop your questions or observations below ![]()
Thank you
Tanvi